Visualizing firearm injury trends by age group over time
Data Visualization
Following reported increases of firearm violence involvement among youth in Philadelphia, I explored firearm injury patterns by age group
over time using Philadelphia Police Department (PPD) criminal and non-criminal shooting records and Philadelphia Annual County Population Estimates. I visualized
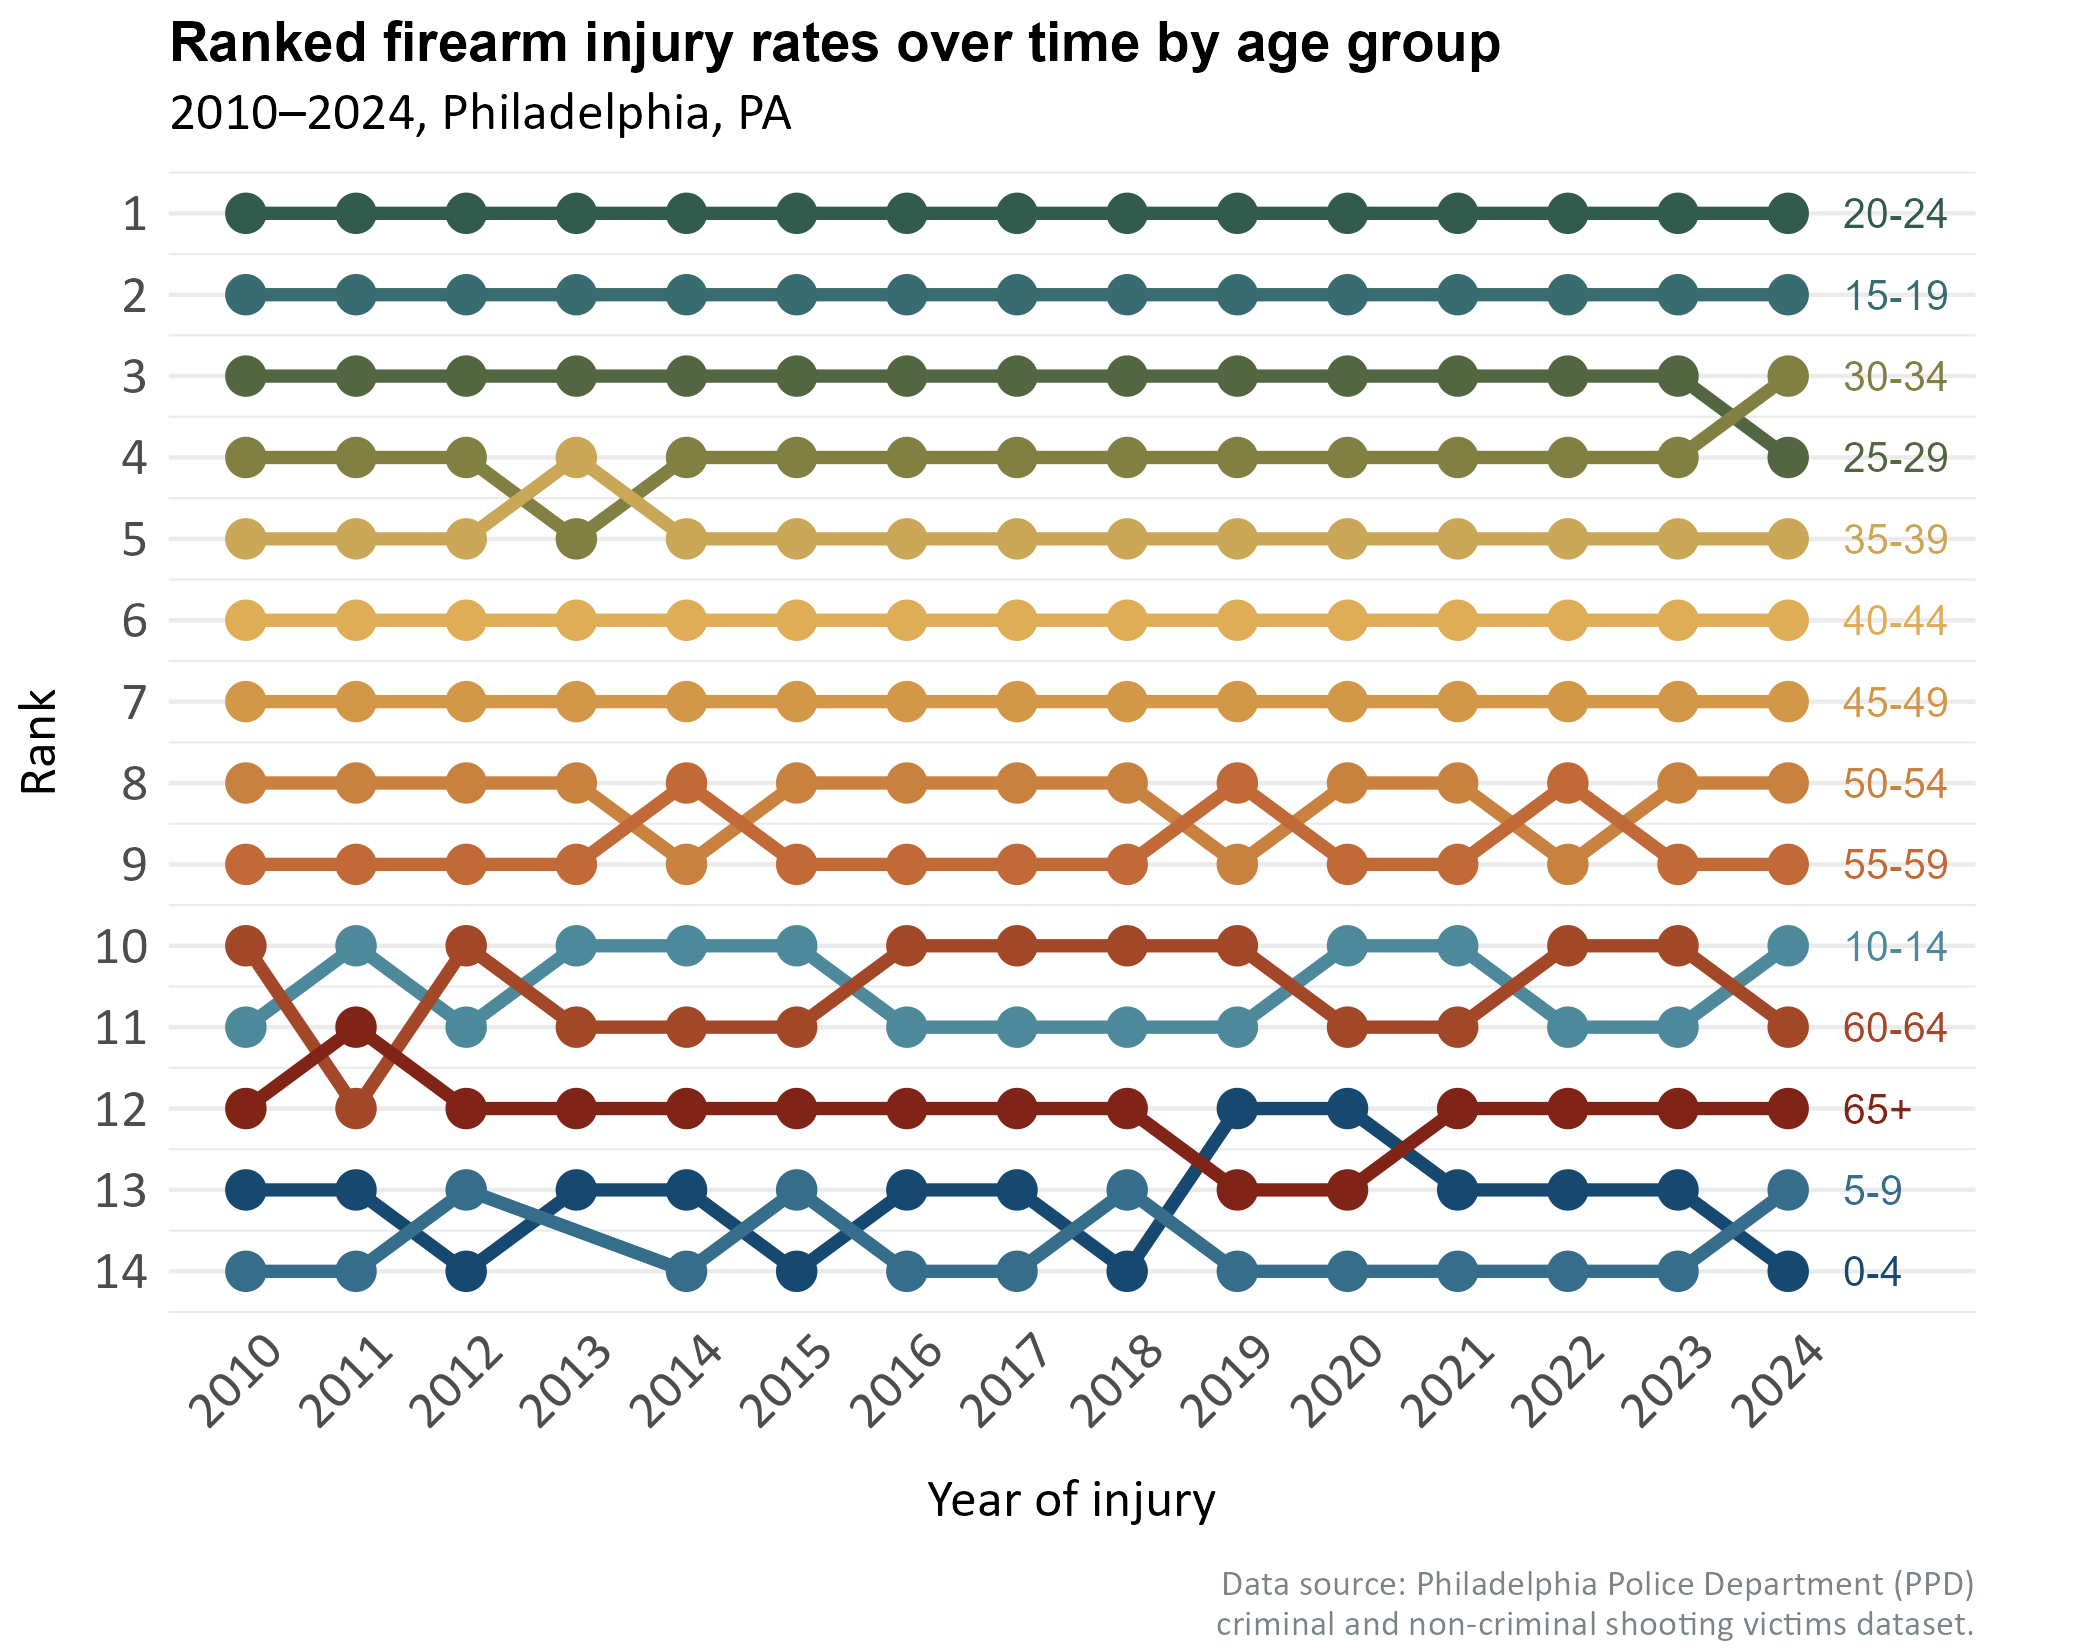
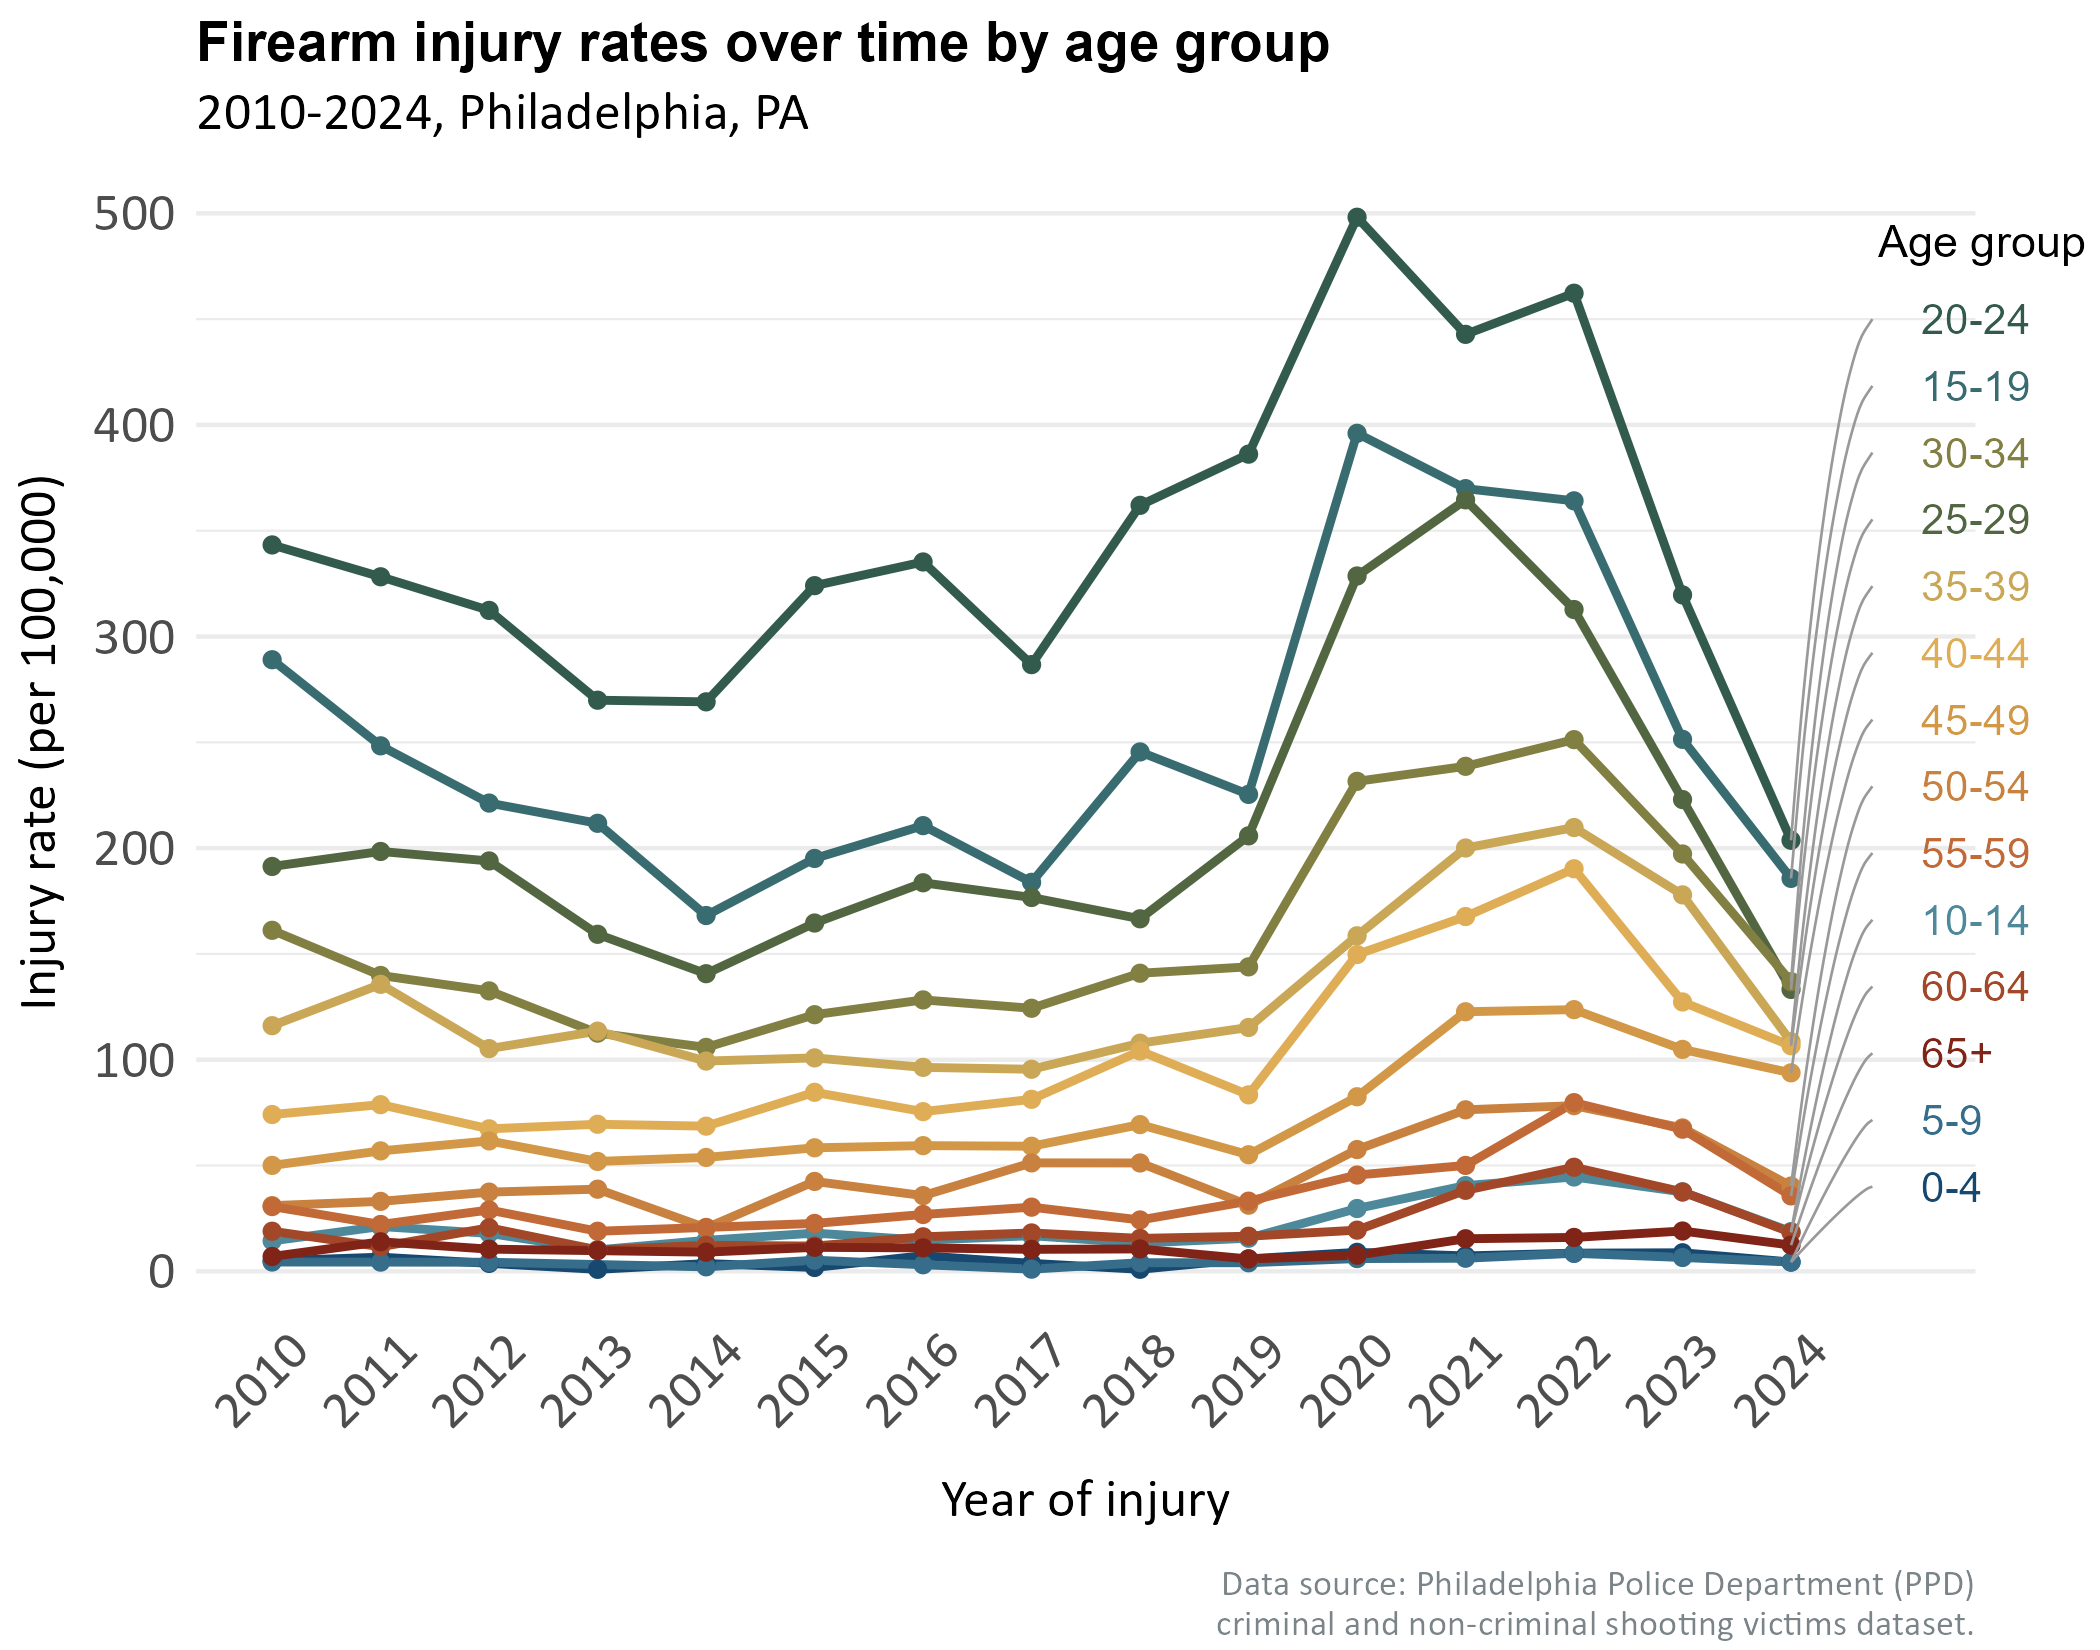
this exploration with a rates plot, a proportions plot, and a ranking bump plot. I found that after steep inclines during the COVID-19 pandemic
in 2020-2022, firearm injury counts and rates have fallen to the lowest point in the past 14 years. These trends are consistent for nearly every age group.
Despite recent declines, Philadelphians aged 15-24 consistently experienced the highest rates of firearm injury from 2010-2024. The highest rates are among those 20-24, followed by 15-19.
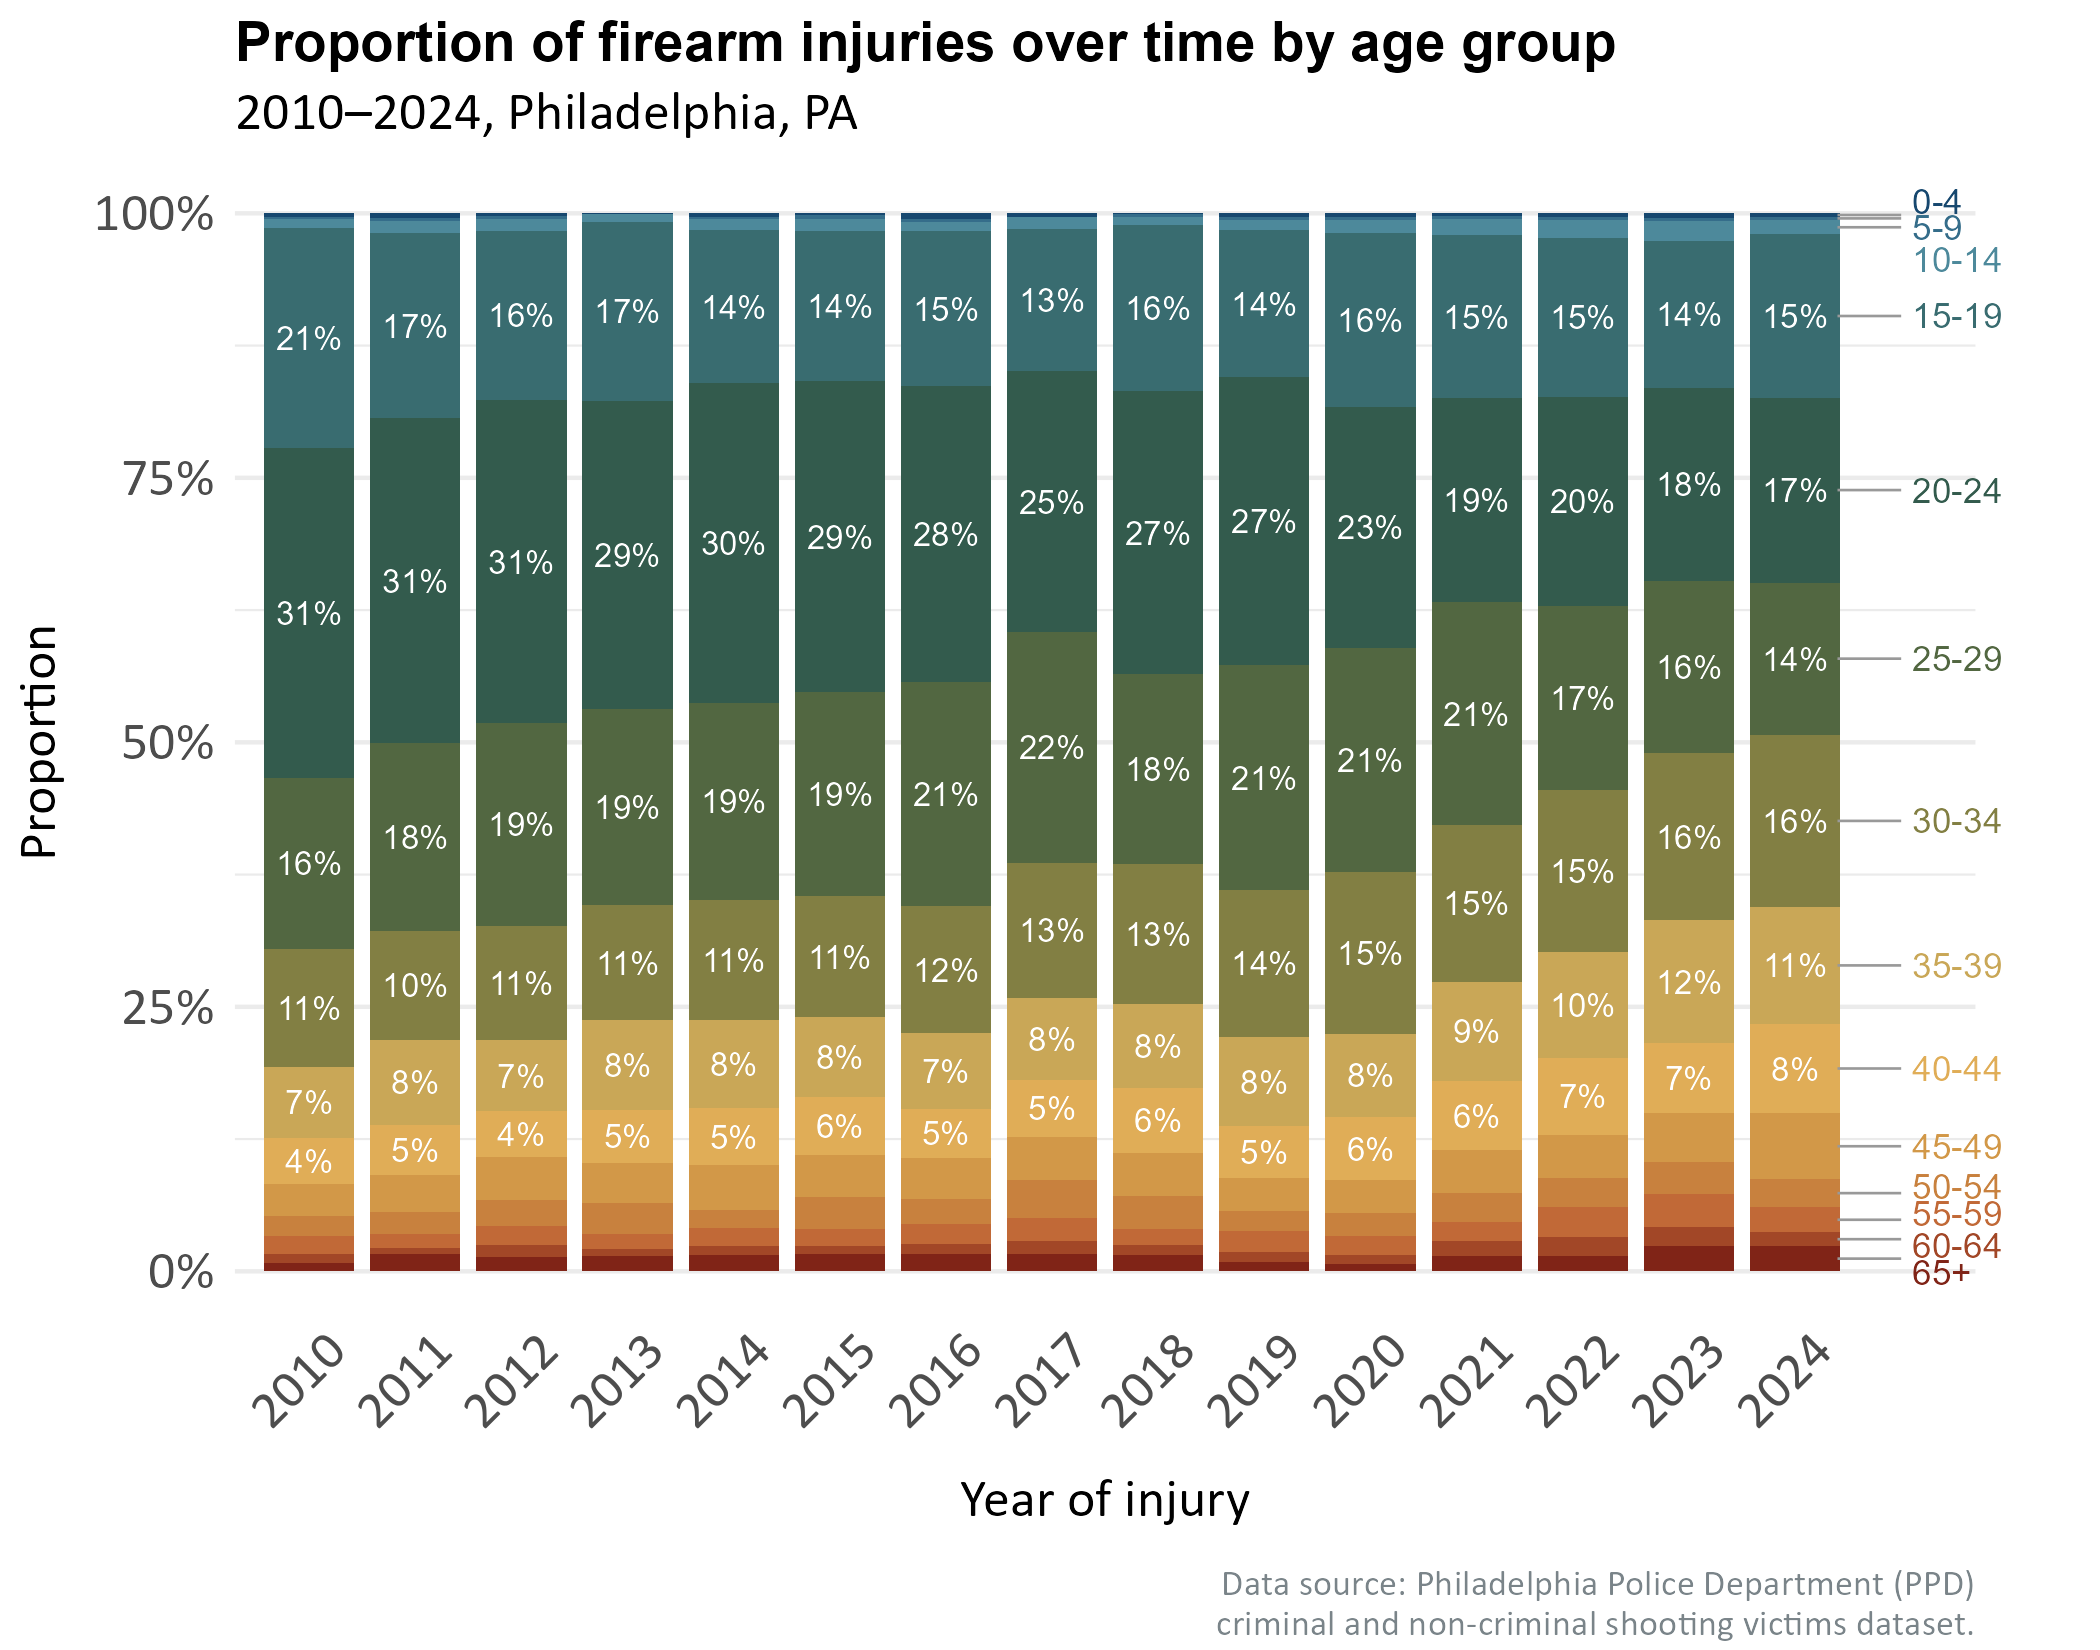
Over the same time period, the proportion of all firearm victims who were aged 15-24 decreased while the proportion of those 30-49 increased. Although firearm violence is declining in Philadelphia,
it remains a public health crisis and burden on all Philadelphians. Continued support of violence intervention
efforts, especially those focused on the populations most at risk, is necessary to continue to reduce the risk of injury.
It's important to note that this exploration uses PPD's shooting victims data -- it provides insights into who was injured by a firearm, and although there is evidence
that there is overlap between those injured and those on the other side of the gun, additional data are necessary to understand overall firearm violence involvement.
The figures were made with the ggplot2 R package. I used ggrepel
for labelling and MetBrewer for the color palette.
Rates
Proportions