Community review of firearm injuries in 2024-2025
Code Development, Data Visualization
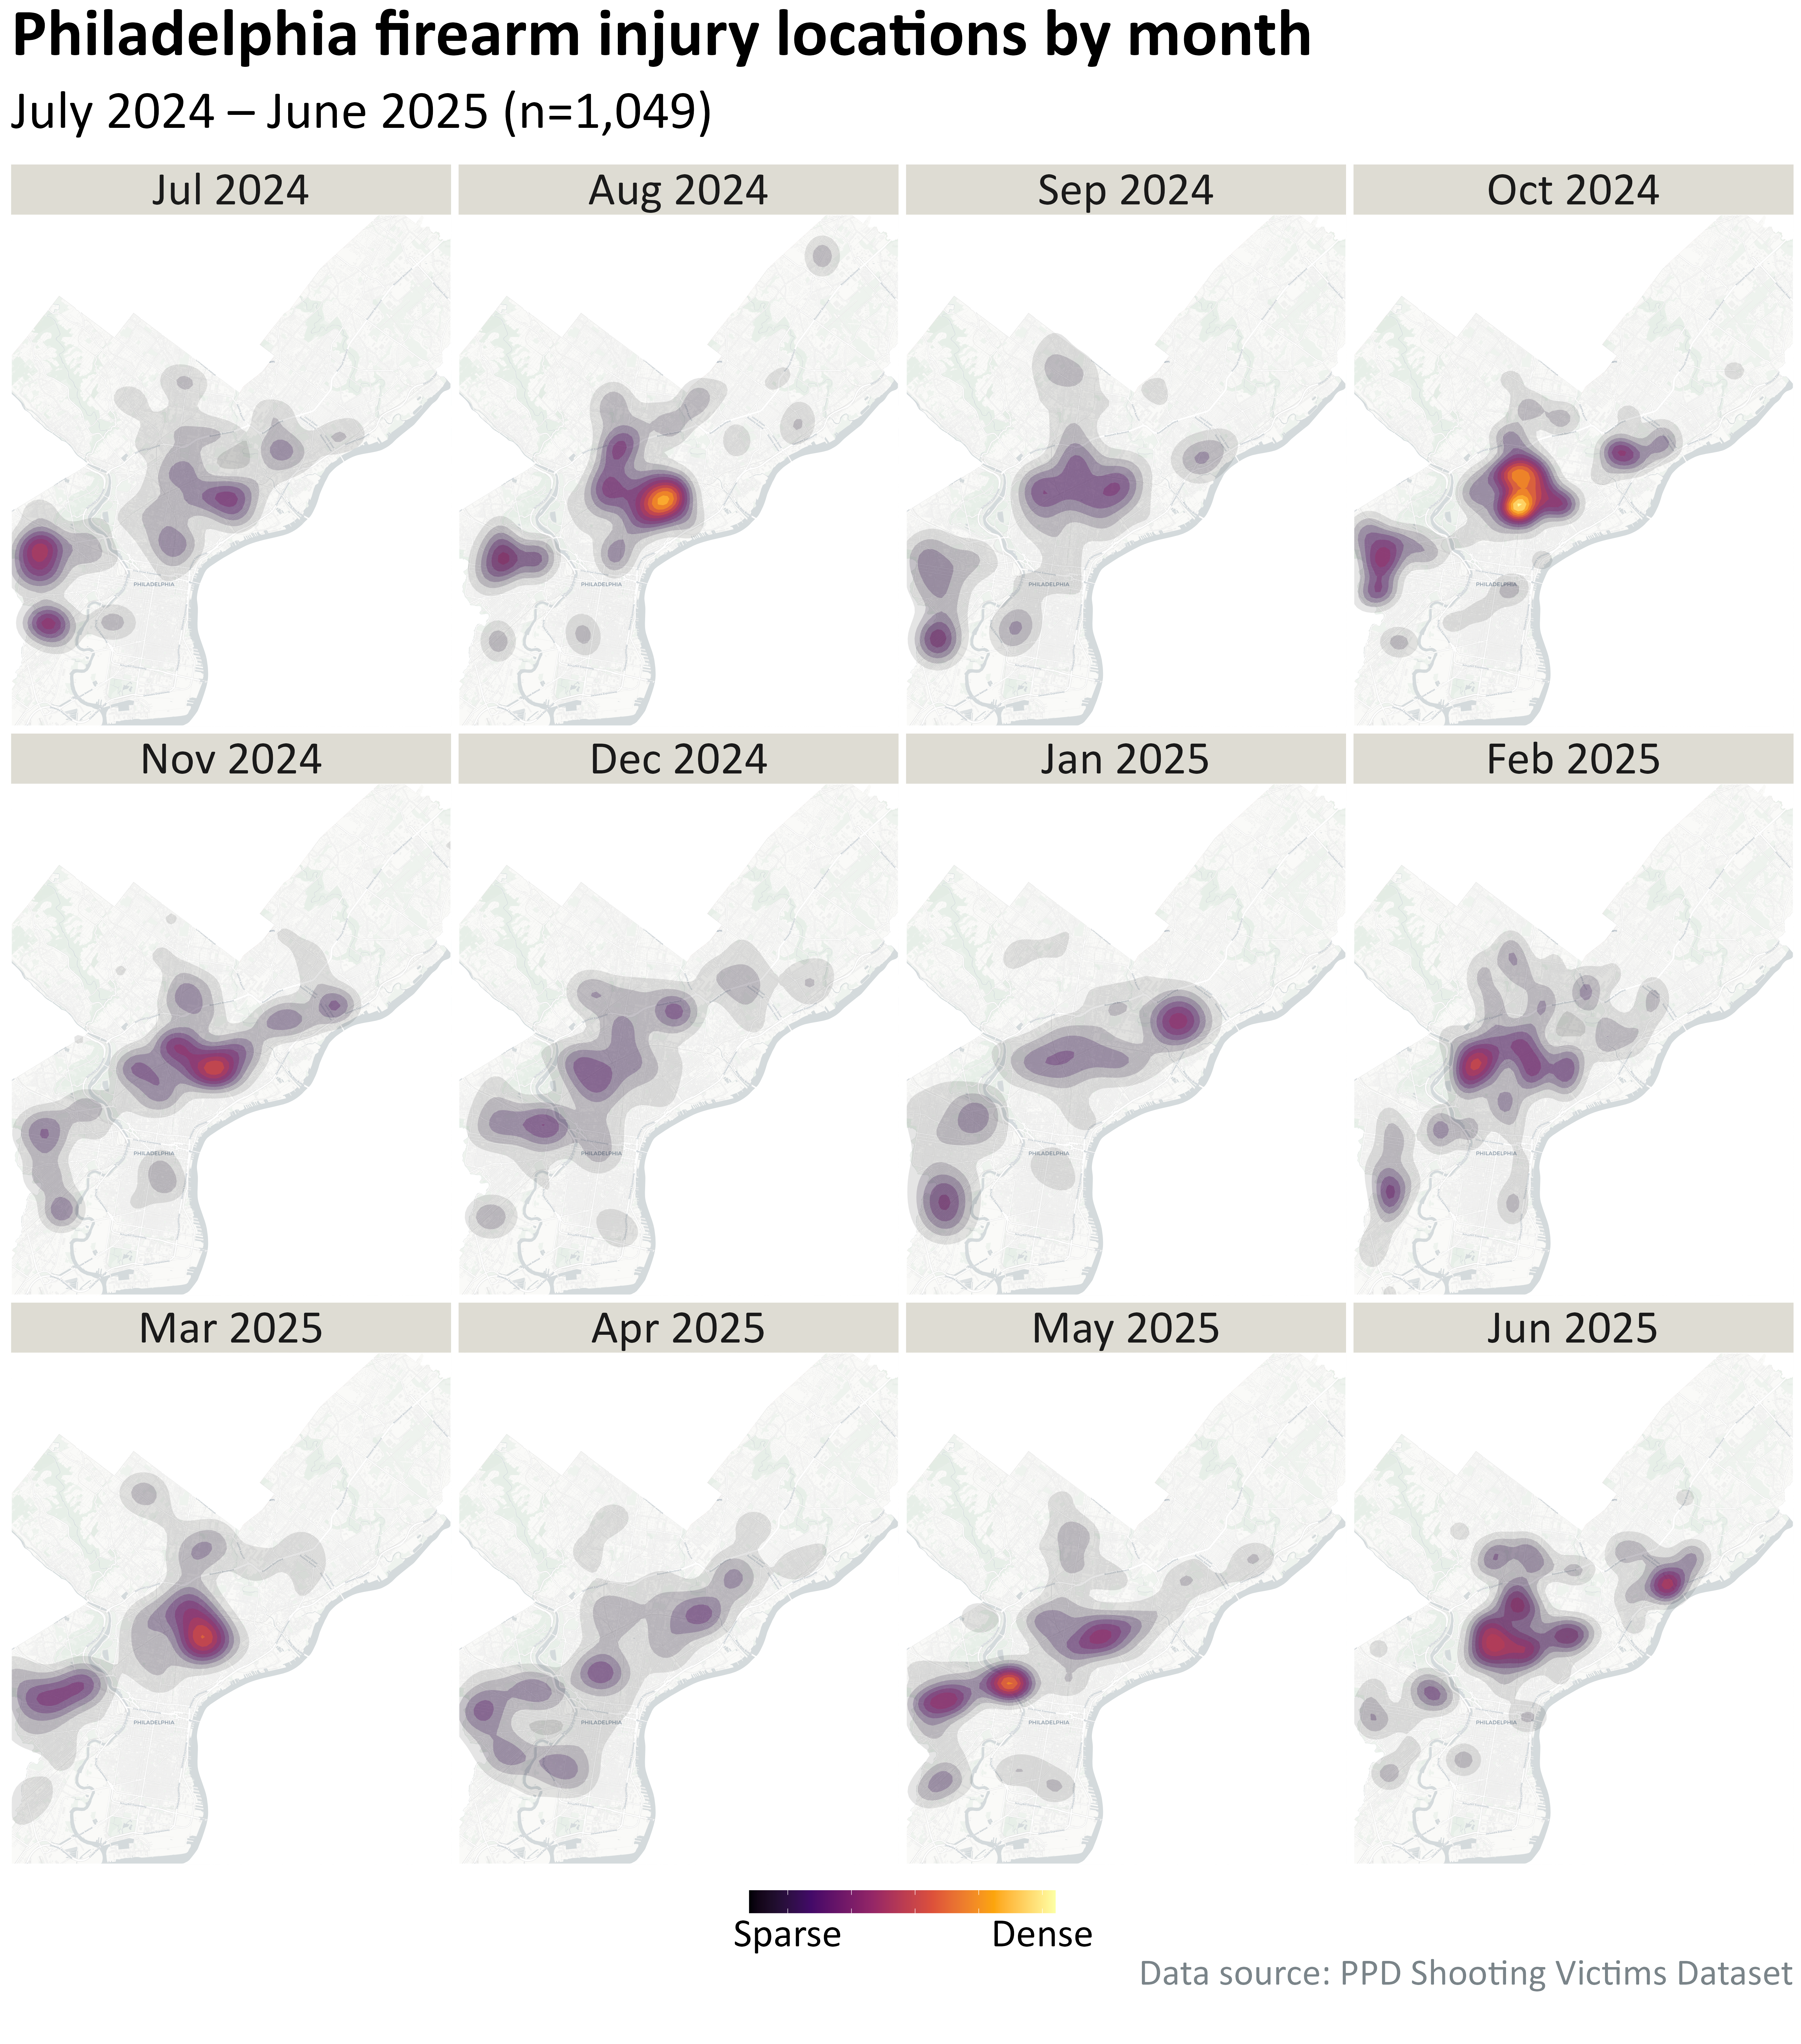
Most of my work at the Philadelphia Department of Public Health (PDPH) supports our coalition of Community Violence Interruption (CVI) programs. Violence interrupters within these programs directly mediate conflict and connect violence-impacted individuals with resources like financial assistance, housing, mentoring, educational support, job training, and more. The work of CVIs is place-based; programs are most successful when the interrupters have credibility within the neighborhoods they work in and are very familiar with neighborhood characteristics and patterns of violence. To better address the needs of our program partners, we are beginning to host shooting reviews that analyze recent firearm injuries and the neighborhood environmental characteristics that are correlated with violence. The goal of these reviews is to better coordinate prevention and intervention strategies among different programs and neighborhood stakeholders.
In my code below, I explore the ggspatial R package (built in the ggplot2 framework). I use ggspatial to create subplots depicting injury hot spots by month over the past year. I use the rosm package to plot an Open Street Map (OSM) basemap, which I clipped to the city boundary for a cleaner visualization. The injury data comes from the Philadelphia Police Department (PPD) Shooting Victims Dataset, which is available on OpenDataPhilly.