Poster: An Analysis of Victim Residences and Injury Locations in Philadelphia
Spatial Analysis
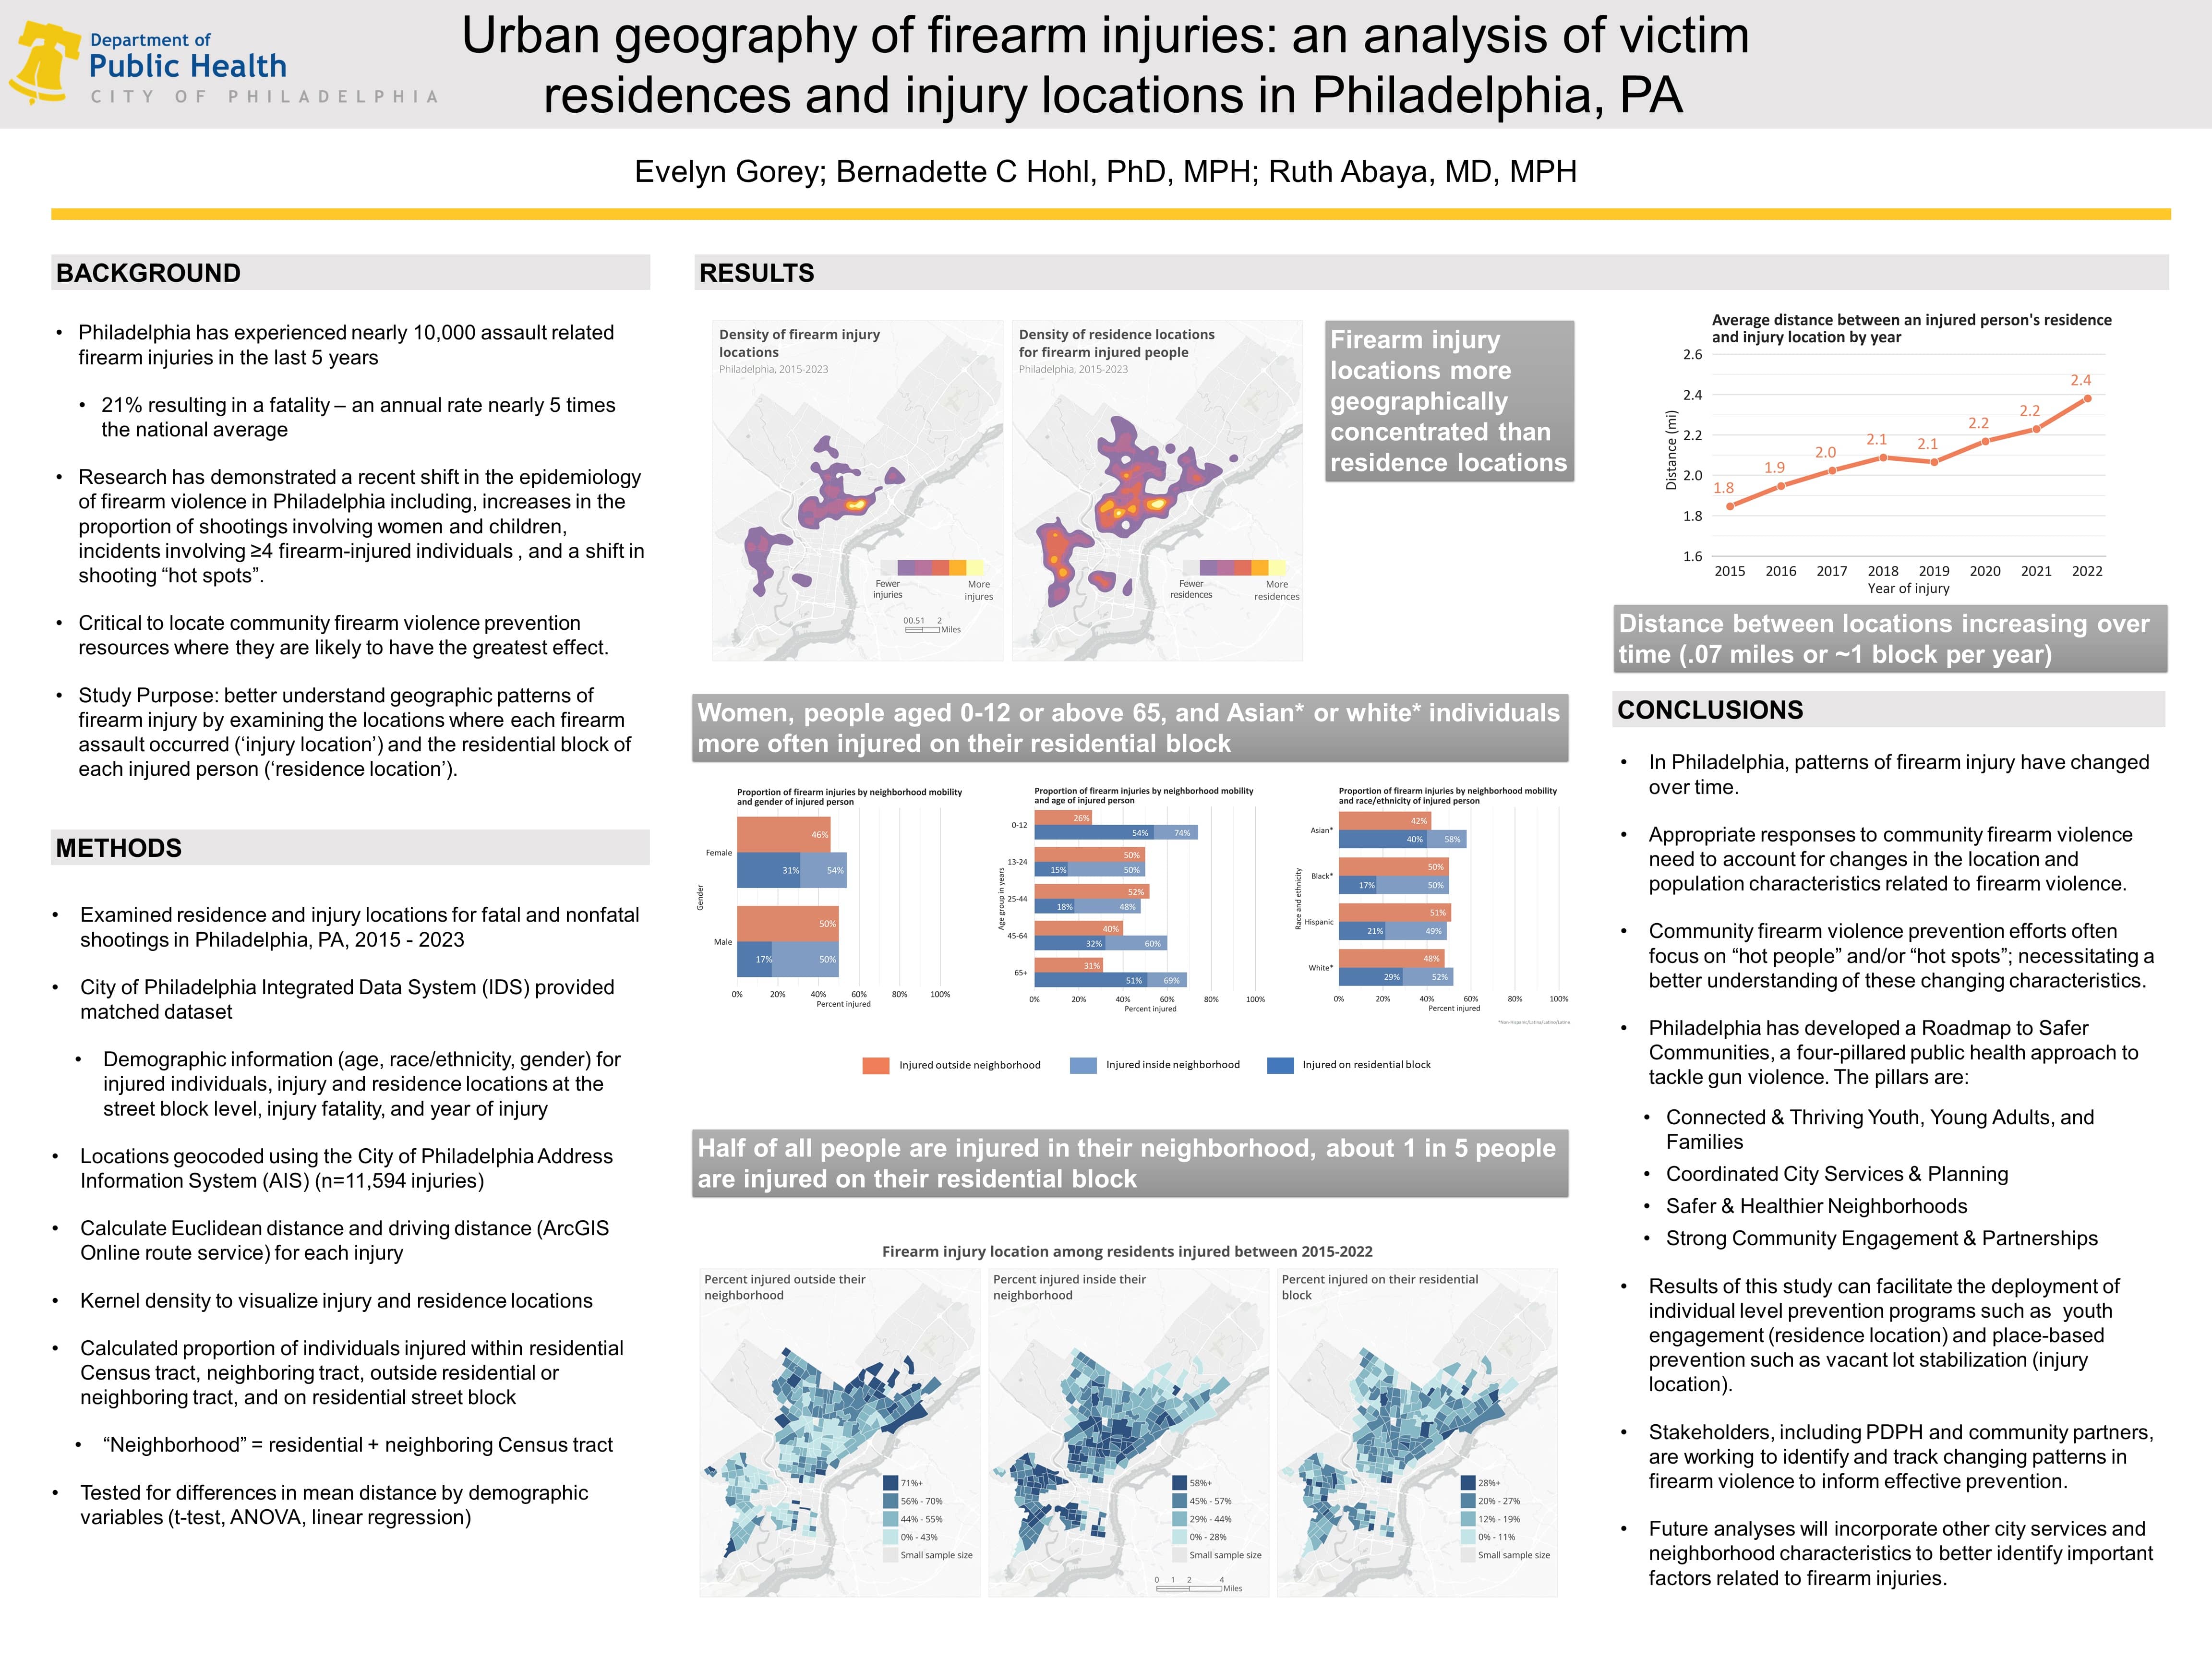
The poster below was presented by my colleagues and I on the Philadelphia Department of Public Health (PDPH) Injury Prevention team at the National Research Conference for the Prevention of Firearm-Related Harms in Chicago, November 2023. Represented is a secondary analysis of de-identified police-derived data to examine the patterns in distance between firearm injury locations and the residences of injured people in Philadelphia between 2015-2022. In the field of firearm injury prevention, criminal justice professionals typically provide the firearm injury location, whereas medical professional provide residence locations for injured people; oftentimes, these two sets of locations are not analyzed in tandem, which is necessary to better understand geographic patterns of violence and to inform the different types of interventions that different stakeholders are leading across the city, such as Cure Violence and other violence interruption programs, neighborhood greening and vacant lot remediation efforts, hospital-based violence intervention programs, community-based youth programs, and more.
I geocoded both sets of injury and residence addresses in R using the City of Philadelphia's AIS geocoder, which is free, more accurate than other Philadelphia geocoders, and can handle large batches of addresses. 78% of the original injuries had accurate residential addresses and were able to be successfully geocoded into separate injury and residence point layers. After geocoding, the points were joined and brought into an ArcGIS Pro/Notebook environment. The road network distance between each matched injury and residence was calculated using the ArcGIS Online network and the LargeNetworkAnalysisTools.pyt toolbox (Solve Large Analysis With Known OD Pairs tool) to allow for chunking and parallel processing. Statistical tests were performed in Python using statsmodels, scipy, and pingouin. I calculated "neighborhood mobility," in which residential and neighboring Census tracts were used as a proxy for neighborhoods, with fiona and geopandas. The maps were produced with ArcGIS Pro and the graphs were produced using seaborn and matplotlib. Census neighborhood-level variables, which will be included in the next steps of this analysis, were accessed through Census, a Python wrapper around the Census API.