Kauri Dieback Analysis: Waitakere Ranges, Aotearoa/New Zealand
Remote Sensing
Below are resulting maps for my Environmental Remote Sensing (Spring 2020) and CAPSTONE final project, which sought to determine the prevalence of Kauri Dieback (the widespread disease of Aotearoa/New Zealand's treasured kauri tree) within a Waitakere Ranges study area on the North Island. Due to the plant pathogen being spread by soil movement, remote sensing analyses provide some of the most accurate and low-risk surveillance measures of the disease. Resulting maps, if based upon high-quality data, can detect even early symptoms of the disease within kauri canopies and can inform more effective planning and management efforts.
My study used four separate datasets in conjunction to classify the study area's vegetation into 3 classes: dead kauri, other trees, and vital kauri. This was accomplished by utilizing machine learning to conduct a supervised land cover classification (Random Forest classification method). The four datasets used in the analysis include a 2016 Landsat 8 image; a 90-meter SRTM-based DEM; mosaicked 2017 0.075-meter orthophotographs; and 1-meter LiDAR-based DEM and DSM.
The Landsat 8 image provided the red and near-infrared bands necessary to calculate NDVI and NDWI, which sought to distinguish vegetation type, health, and moisture content among the study area. The SRTM-based DEM provided the slope and aspect calculations in order to apply topographic correction to the Landsat 8 image, and the mosaicked orthophotographs' bands provided the high-resolution base imagery to draw the training polygons. The LiDAR-based DEM and DSM images were used to calculate Topographic Openness to better distinguish terrain differences within the study area as to eliminate shadow-based confusion.
Study Area
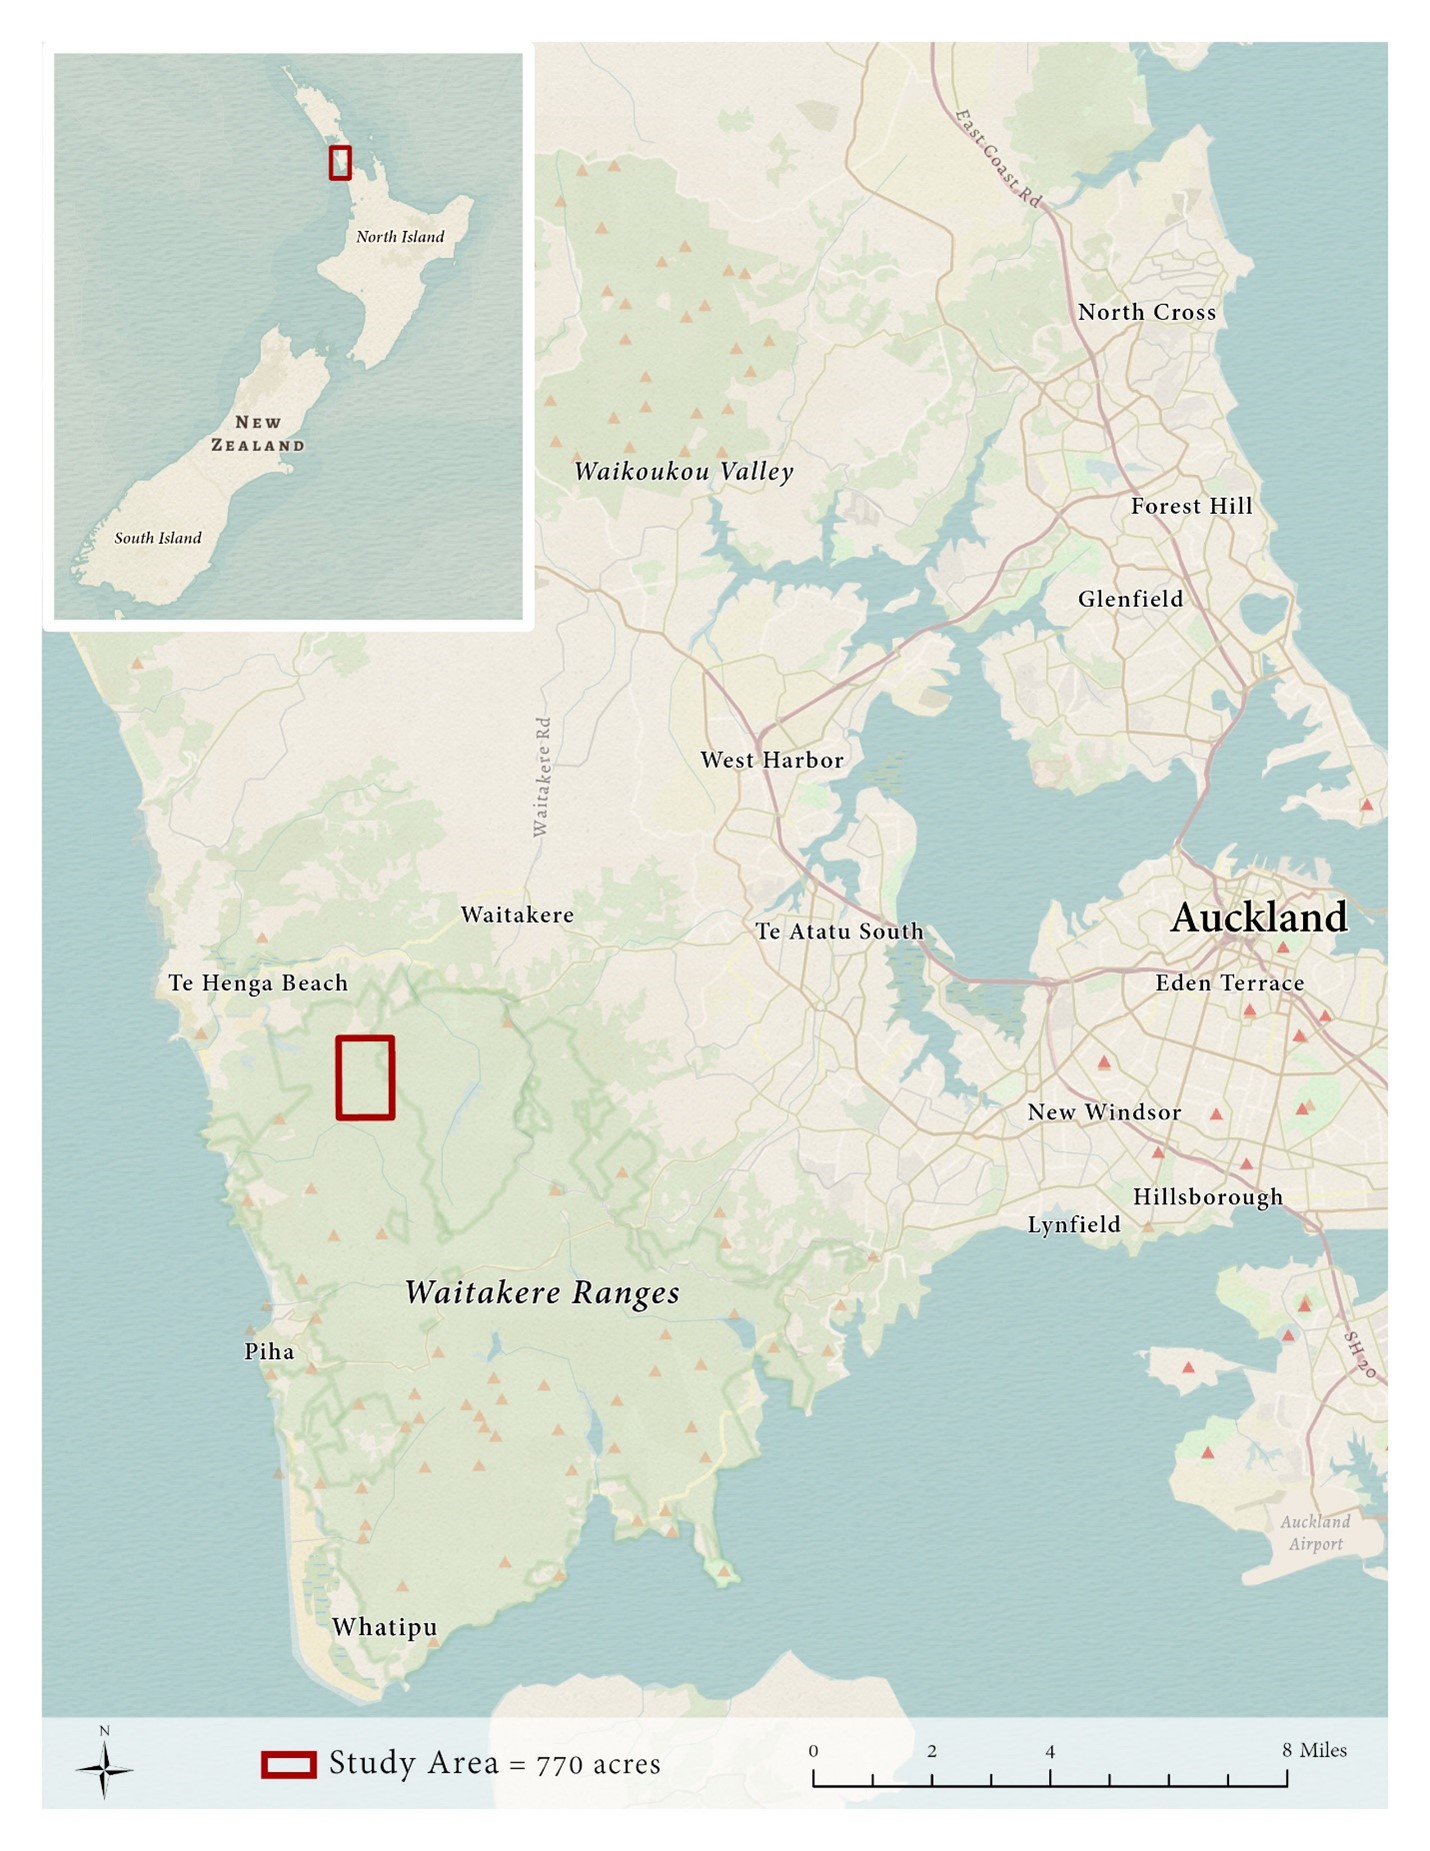
The study area is located within the Waitakere Ranges, which is the most heavily impacted kauri forest within the country. The Waitakere Ranges are located west of Auckland, which is Aotearoa/New Zealand's most densely-populated city. The total study area is 770 acres (311 ha).
Supervised Classification Results
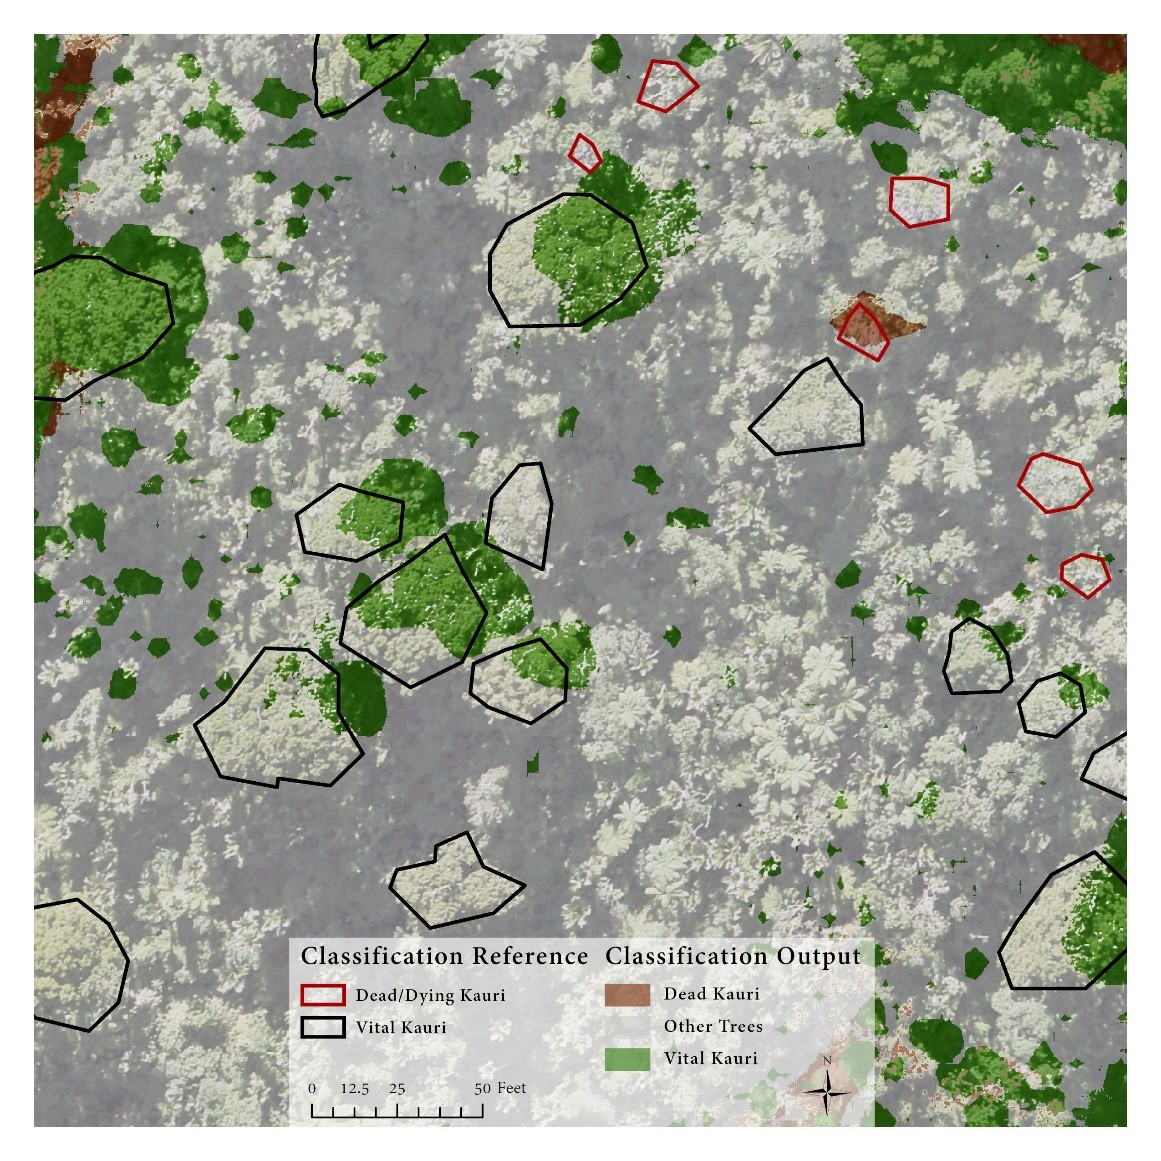
The overall accuracy for the supervised classification was low (48%); this is due to a lack of additional NIR and IR bands with high spatial resolution. Due to the lack of a budget, the best available free, open-source data was used. The Landsat 8 image provided the NIR and IR bands, yet it only had a 30-meter spatial resolution; if additional high-resolution NIR and IR bands were included, the classification likely would have been more accurate. The majority of the classification did not accurately classify the study area into the 3 appropriate classes, though the above map presents a section within the study area that semi-accurately classifies the canopy.
The "classification reference" polygons represent the accurate locations of dead/dying kauri trees and vital kauri trees, whereas the "classification output" represents what the machine learning supervised classification identified. As can be seen, the classification is still not very accurate; however, some vegetation (such as the appropriate location of a dead kauri tree as well as multiple appropriate locations of vital kauris) is classified accurately. This indicates that with additional high-quality data, remote sensing techniques have the potential to accurately analyze Kauri Dieback within various kauri regions.