Arizona Environmental Justice Characteristics
Web Mapping, Spatial Analysis
In my recent studies regarding the locations of Superfund sites (or sites contaminated by hazardous waste and therefore managed by the Environmental Protection Agency (EPA)), I found that 532 (nearly 25%) total Superfund sites are located in Indian Country, or in territories governed by Indigenous communities.
Superfund sites are characterized by severe pollution and then abandonment by corporations, which in turn dumps the serious environmental, health, and economic consequences affiliated with these sites onto nearby residents. On Navajo lands in particular, over 500 abandoned uranium mines (not all of which are currently Superfund sites) have contributed to dangerously high levels of radiation, which contaminates homes and water sources. Other recent research findings illustrating the socioeconomic and racial disparities in the impacts of pollution in addition to the release of the EPA’s nationwide Environmental Justice Screening dataset have inspired me to analyze and map various environmental justice characteristics in the state of Arizona, which includes Navajo lands.
The overarching goals of this analysis are to use the EPA Environmental Justice Screening dataset to:
1) determine to what extent the percentage of minority (non-white) populations is correlated to variables such as cancer risk and proximity to Superfund sites and to
2) determine the suitability of this dataset in modeling these socioeconomic and racial disparities that I have researched.
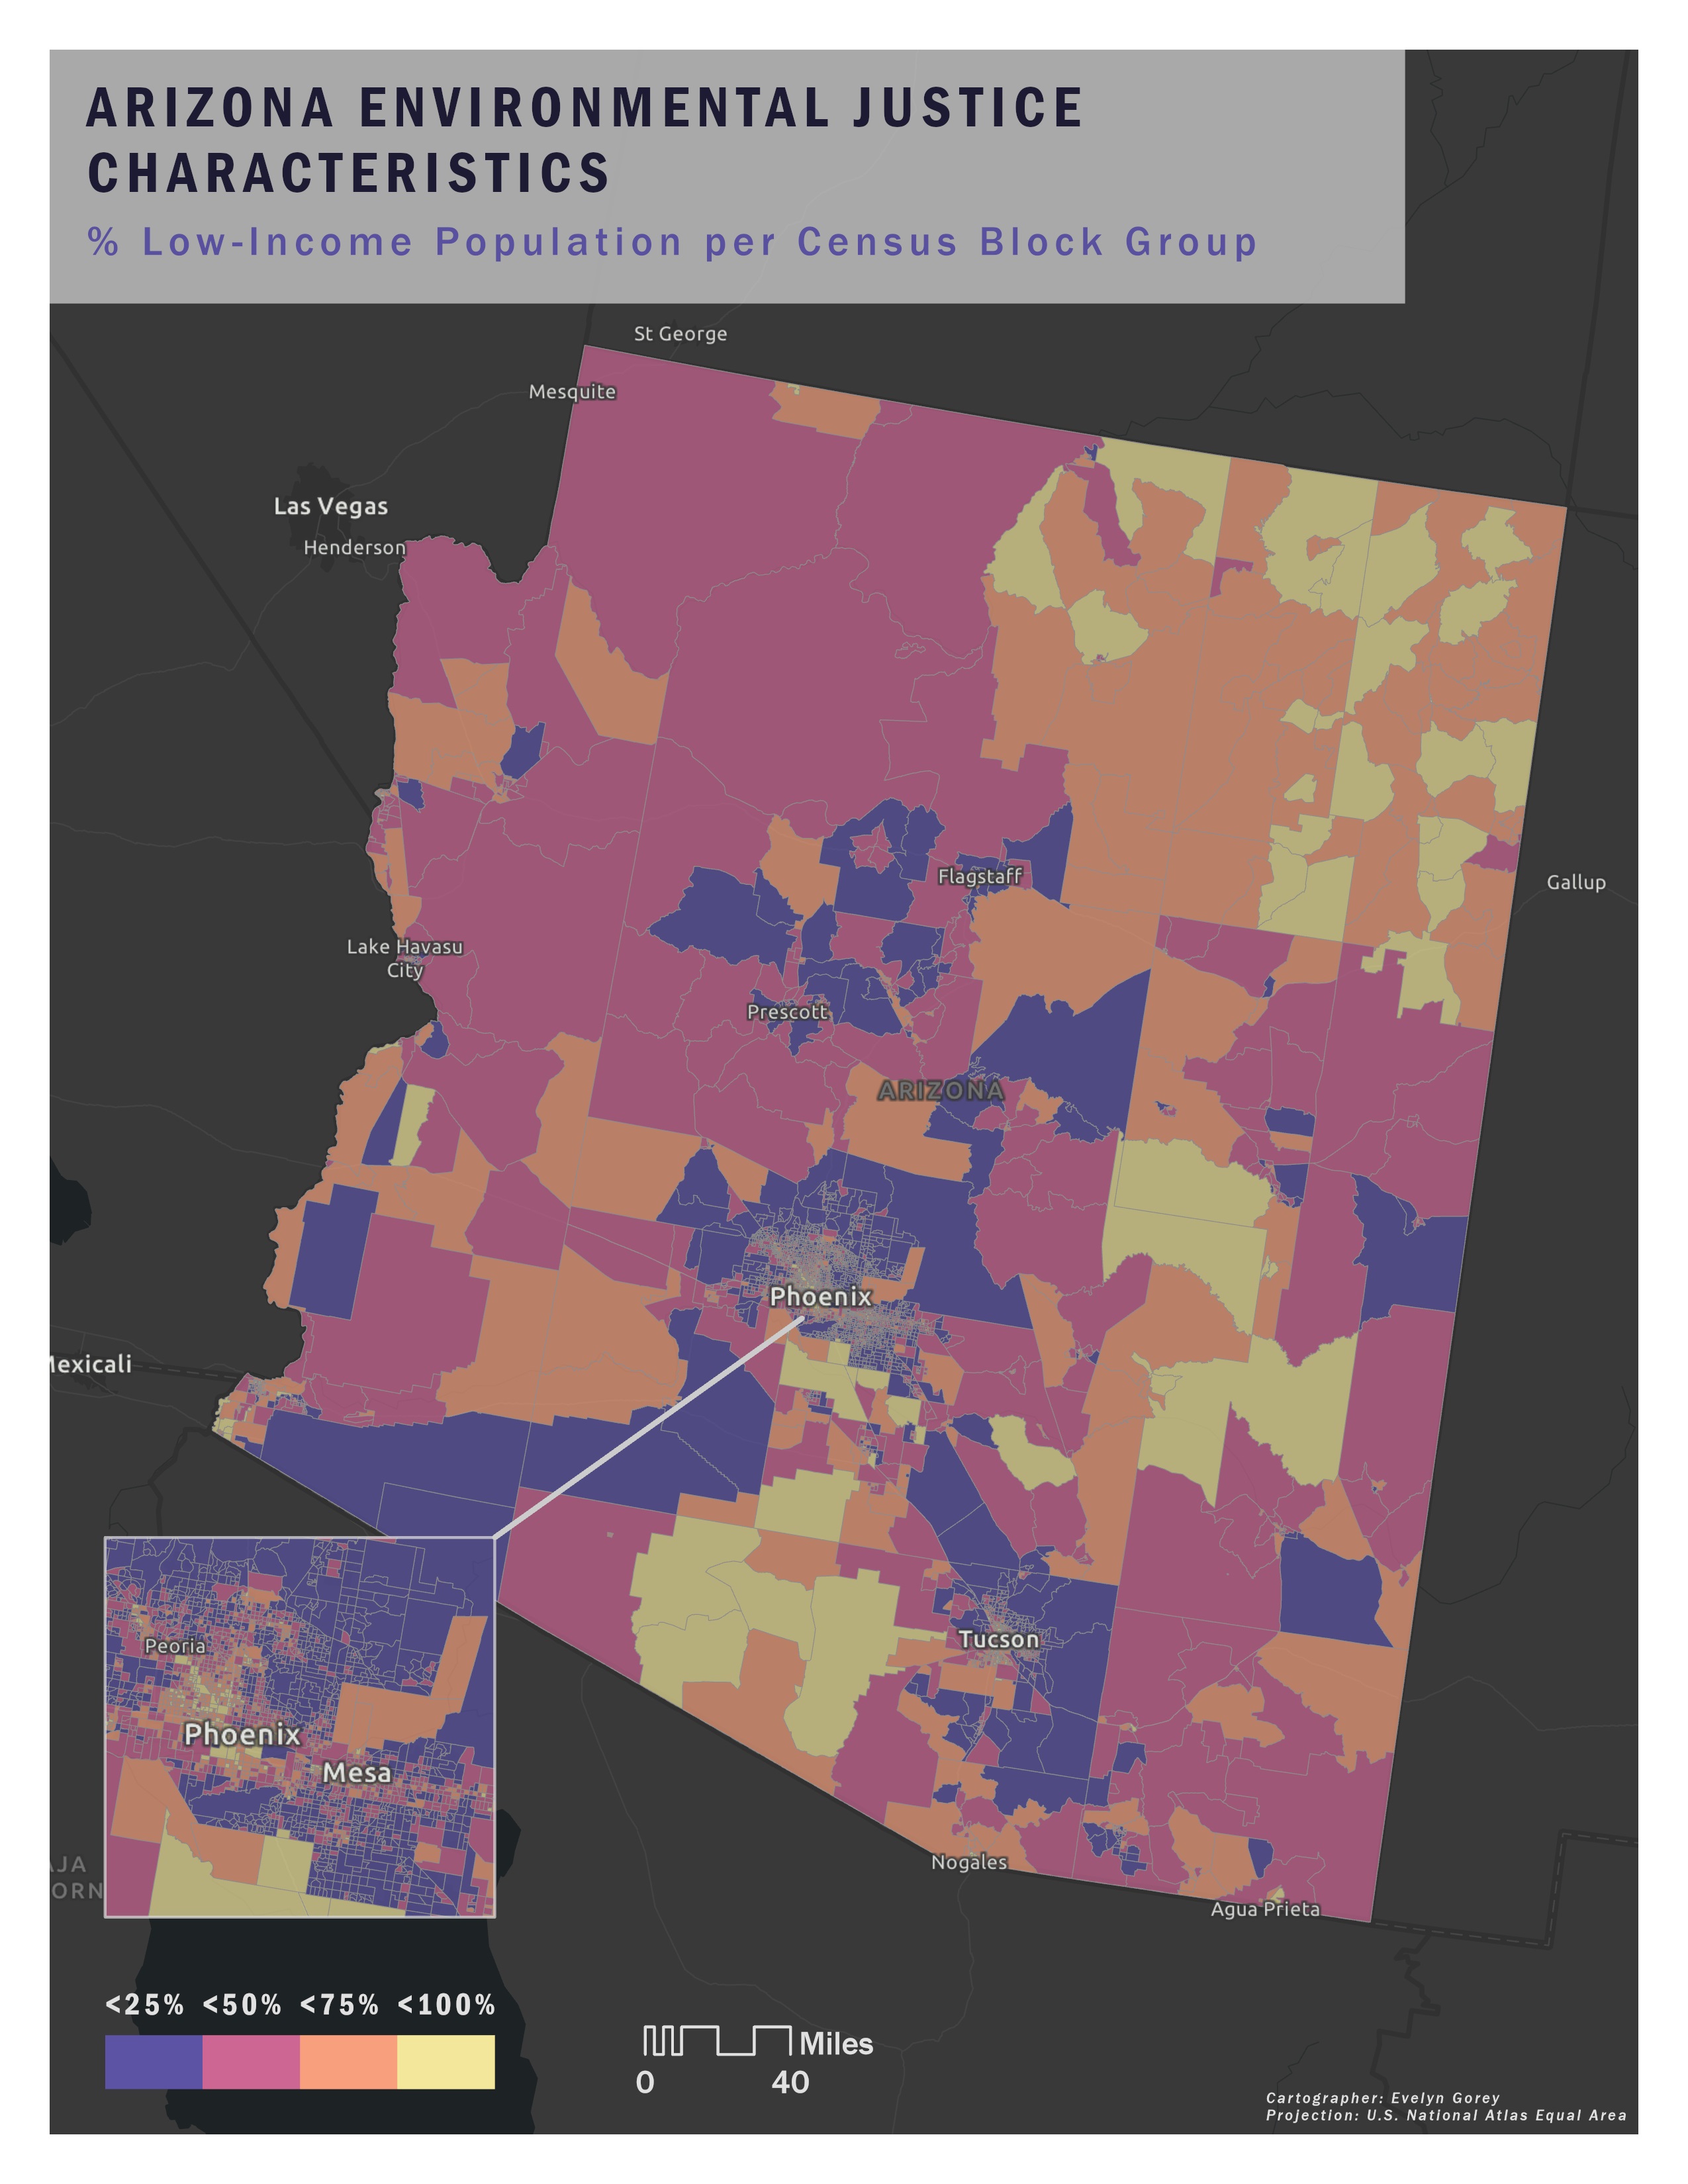
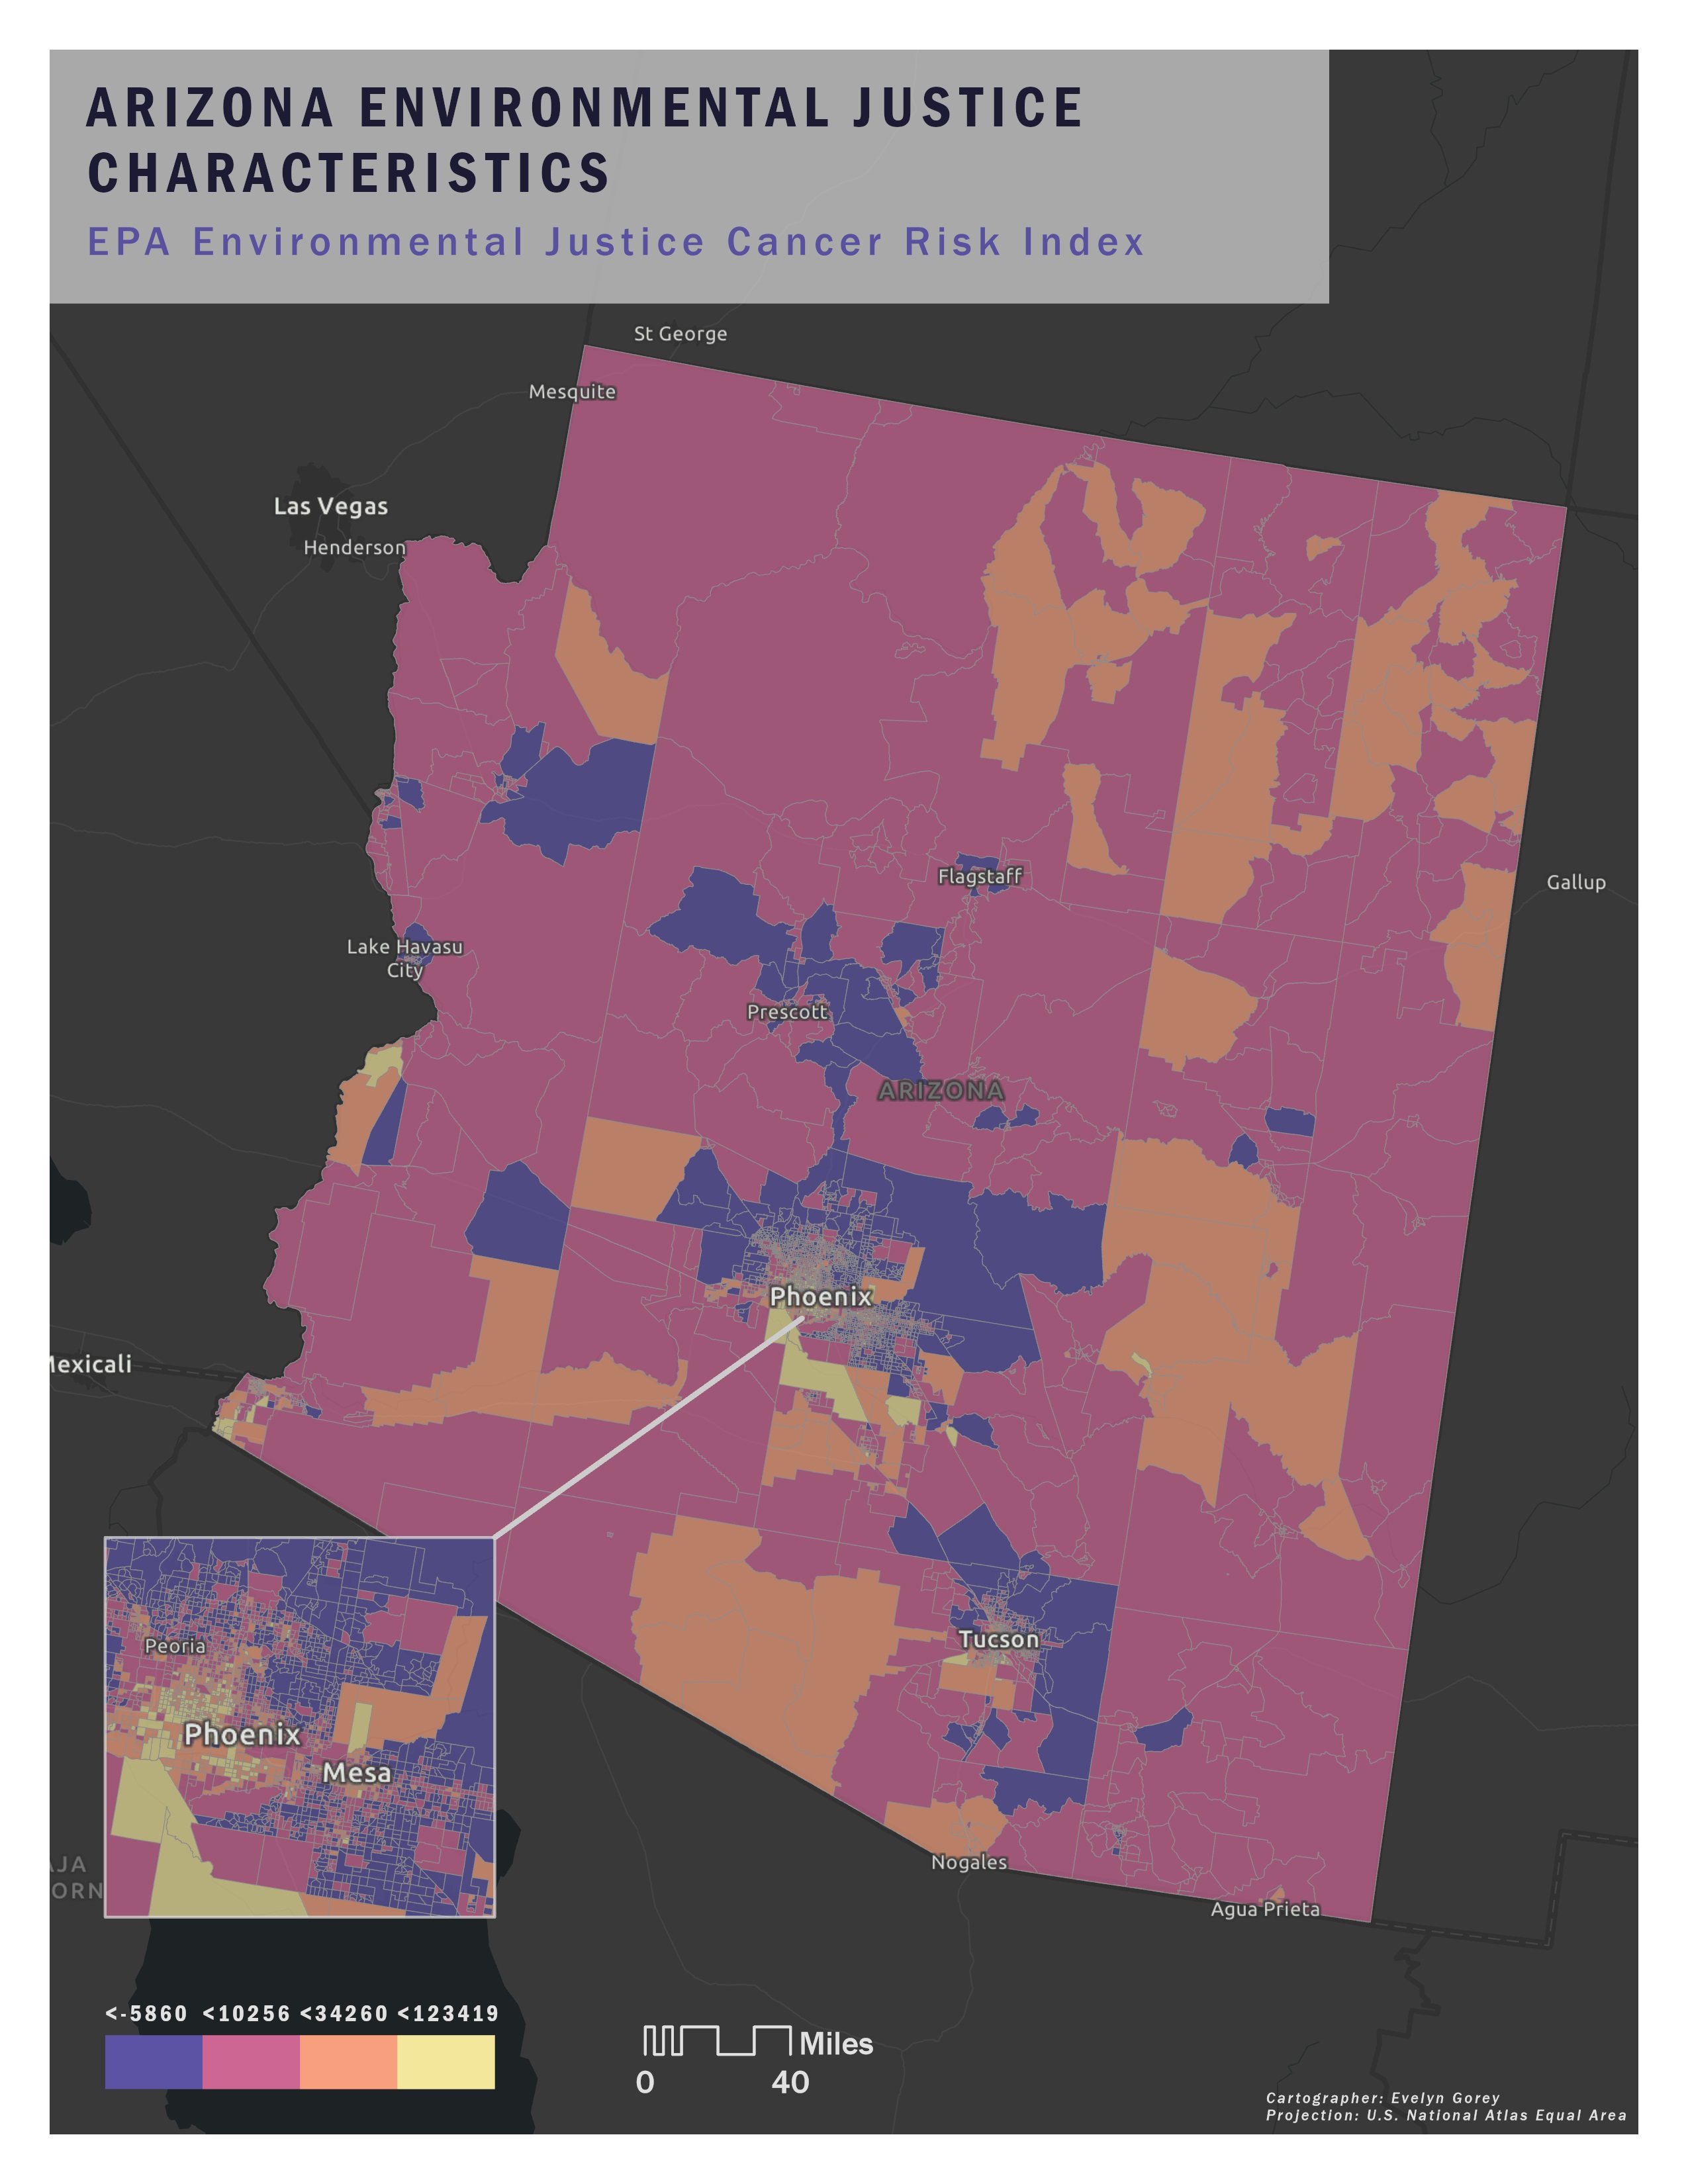
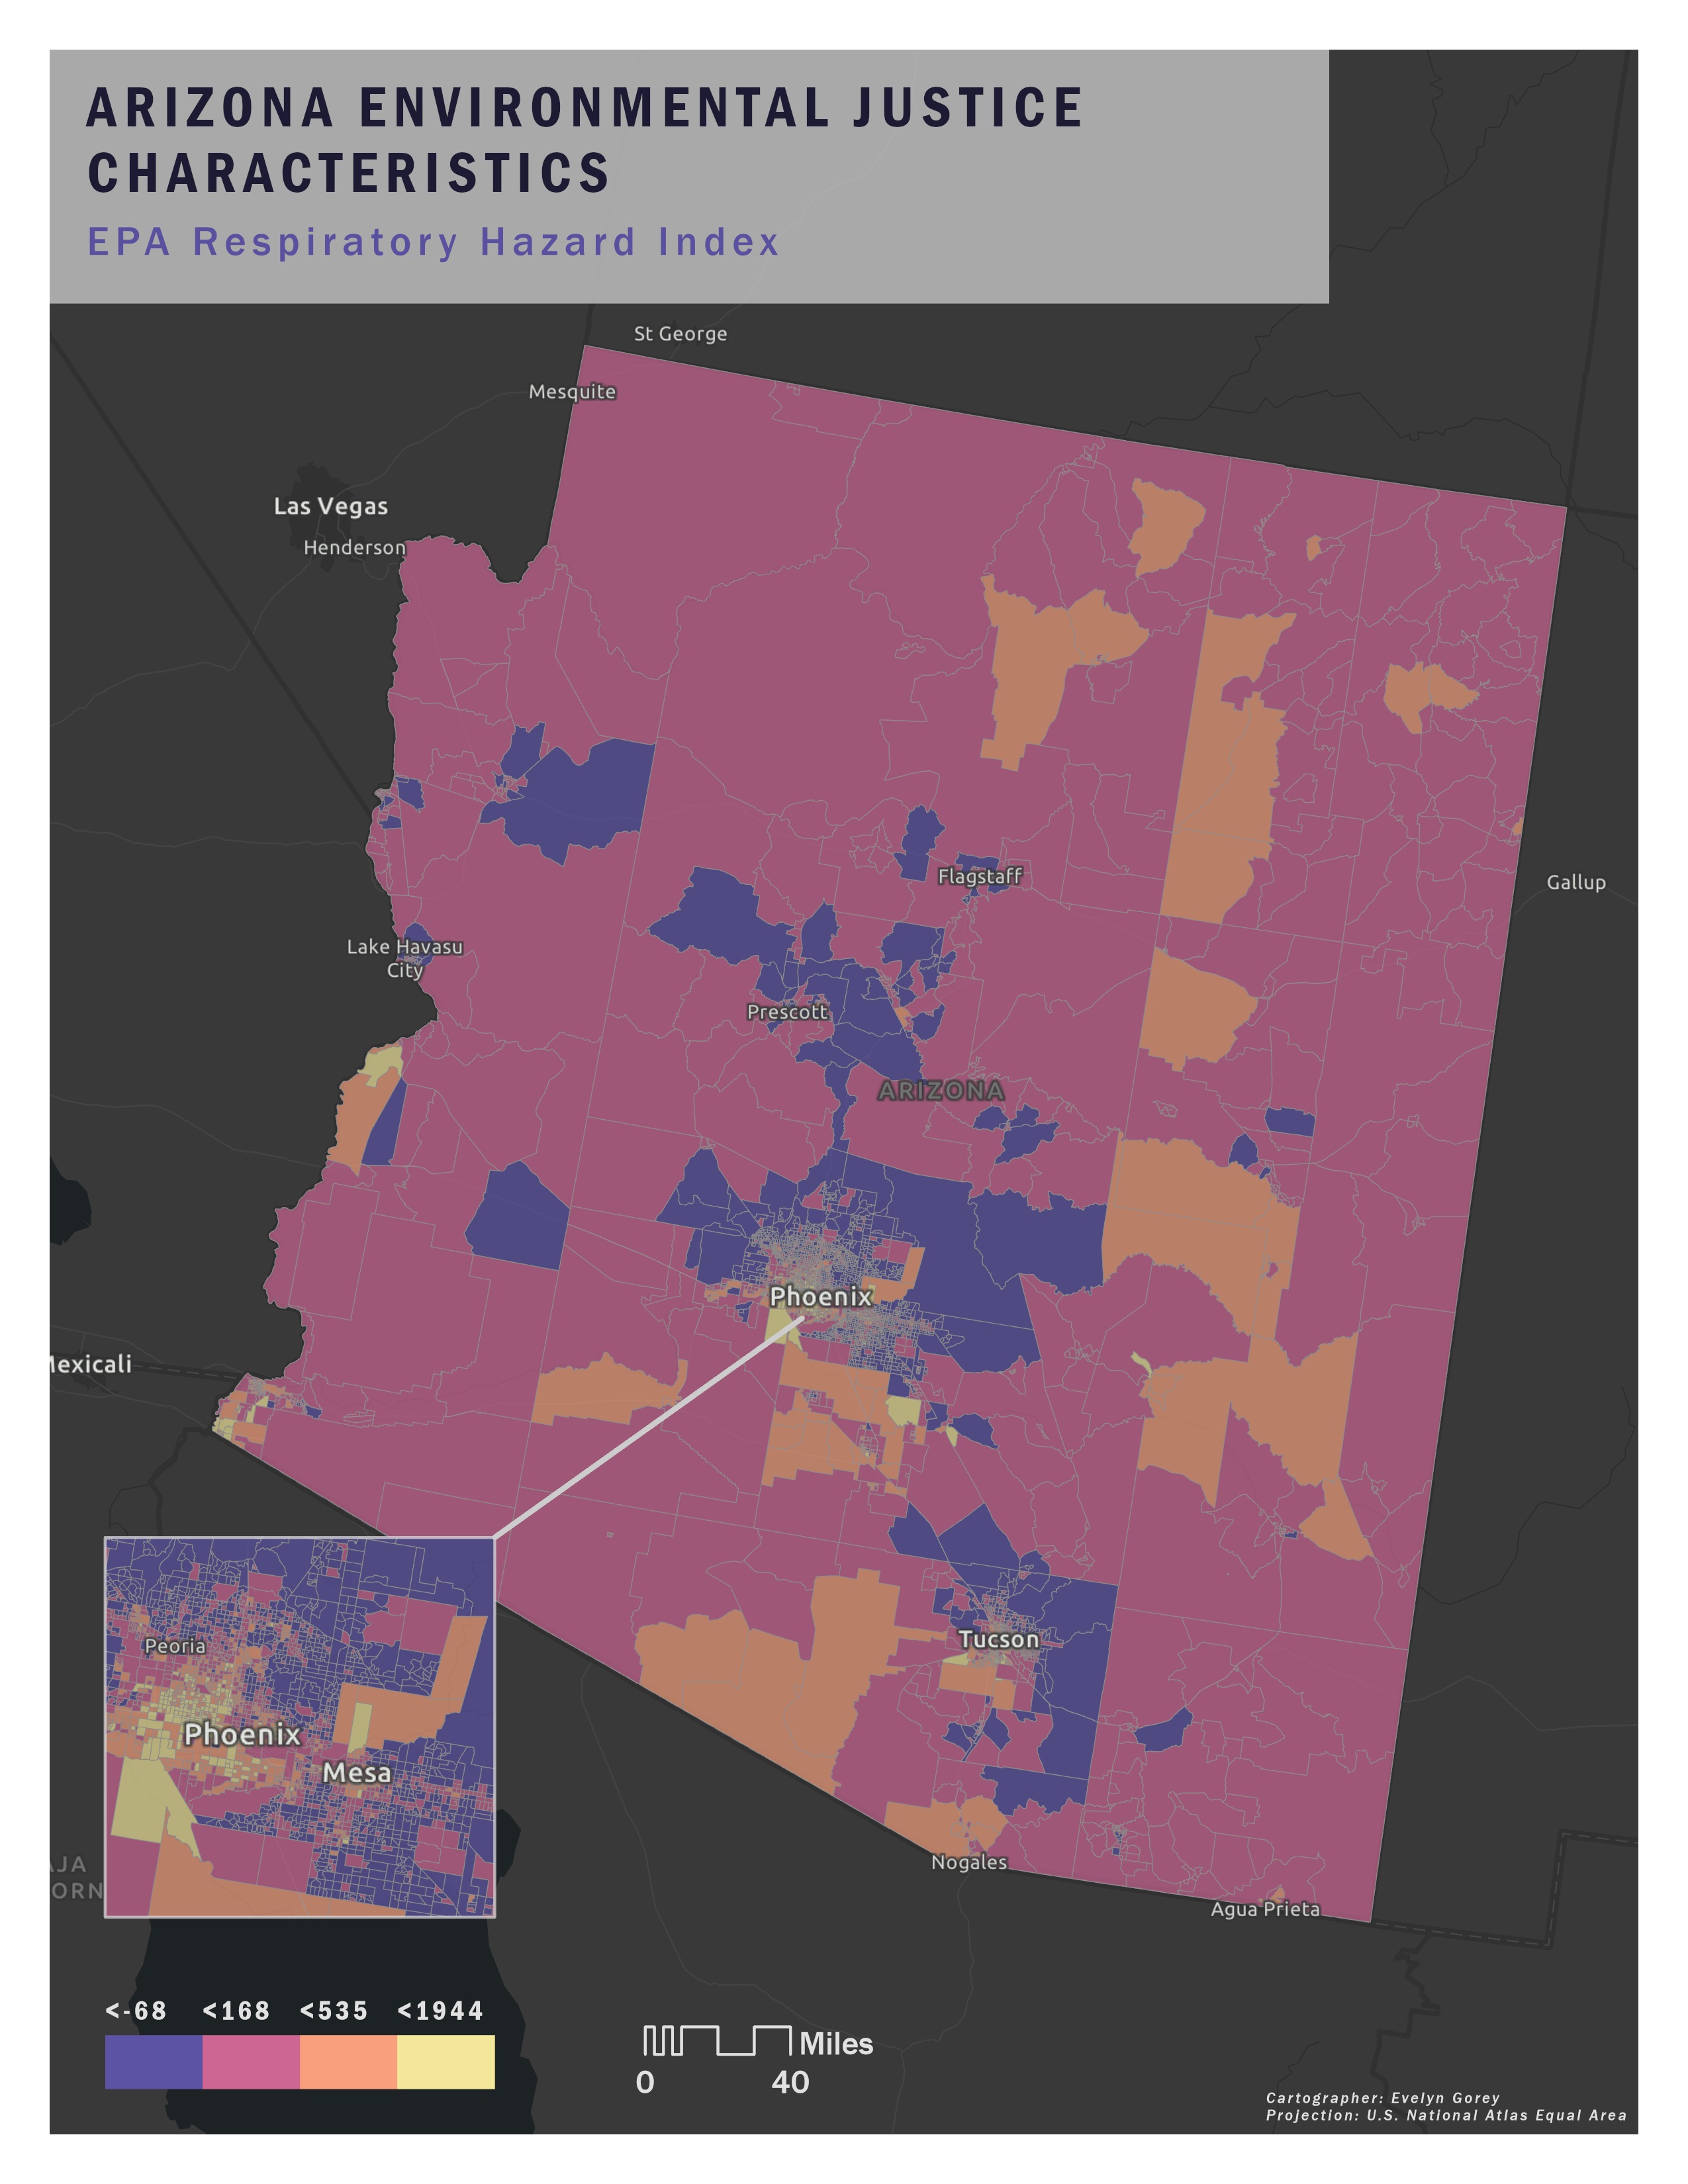
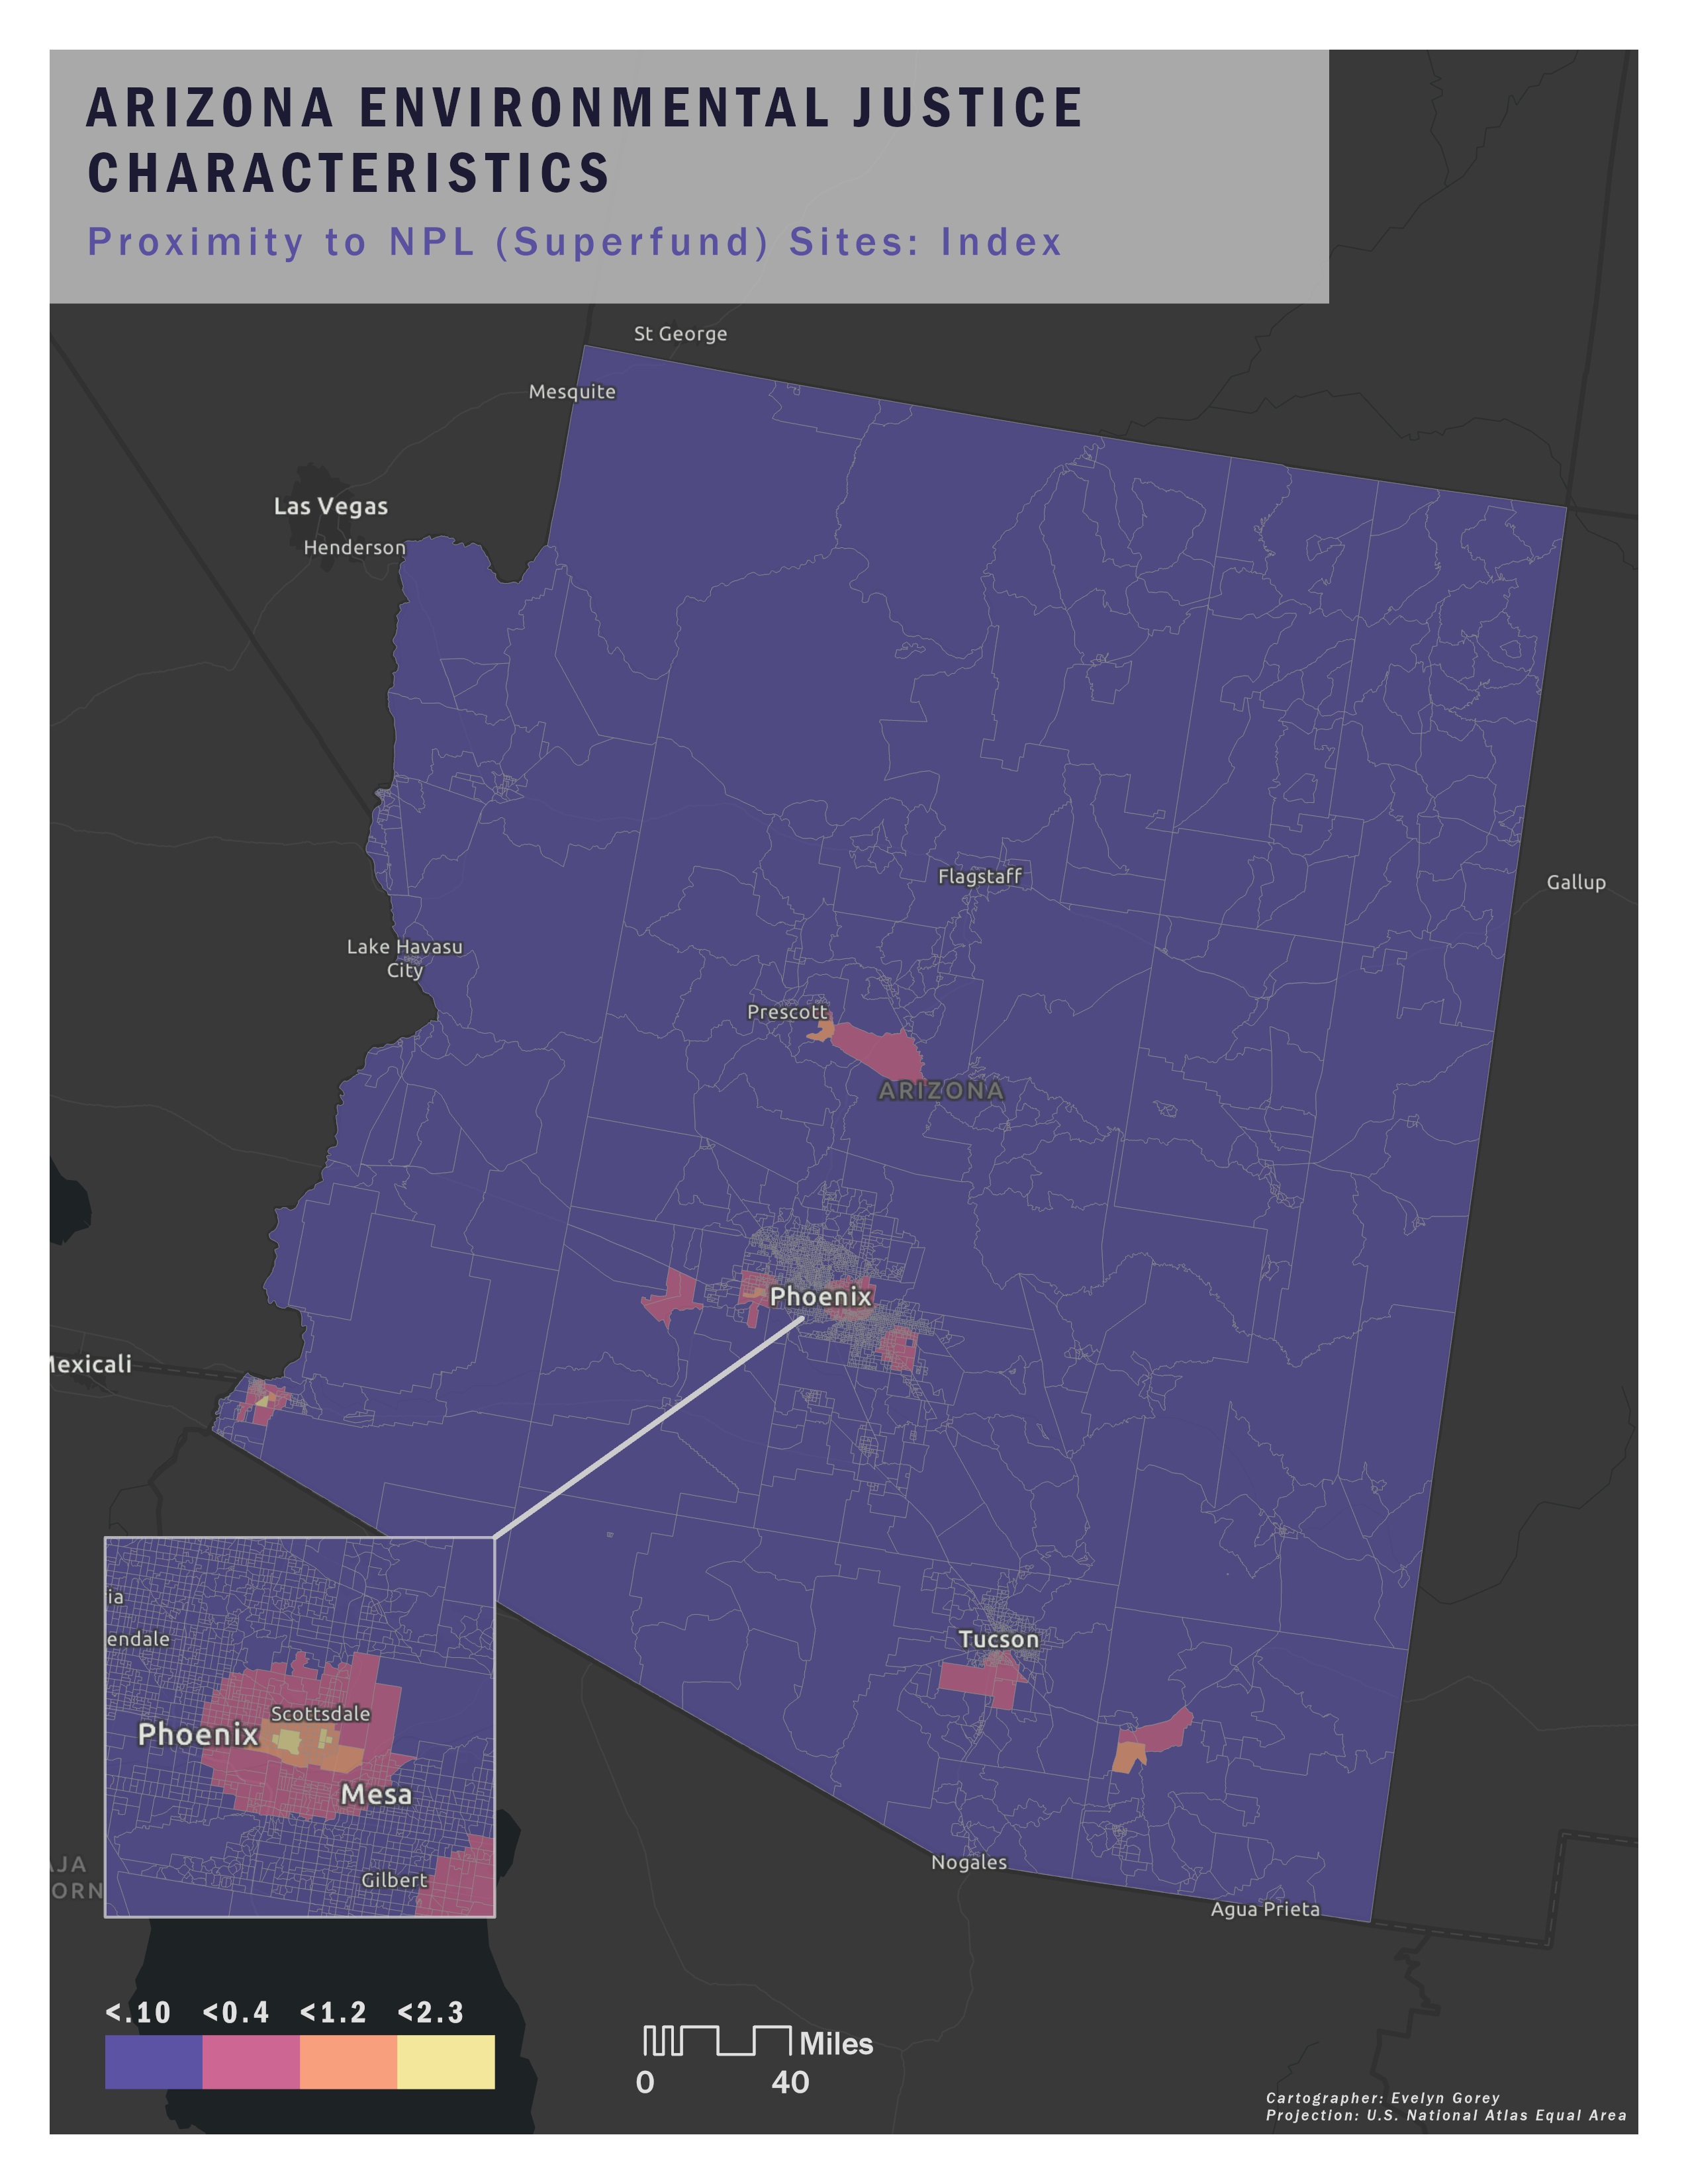
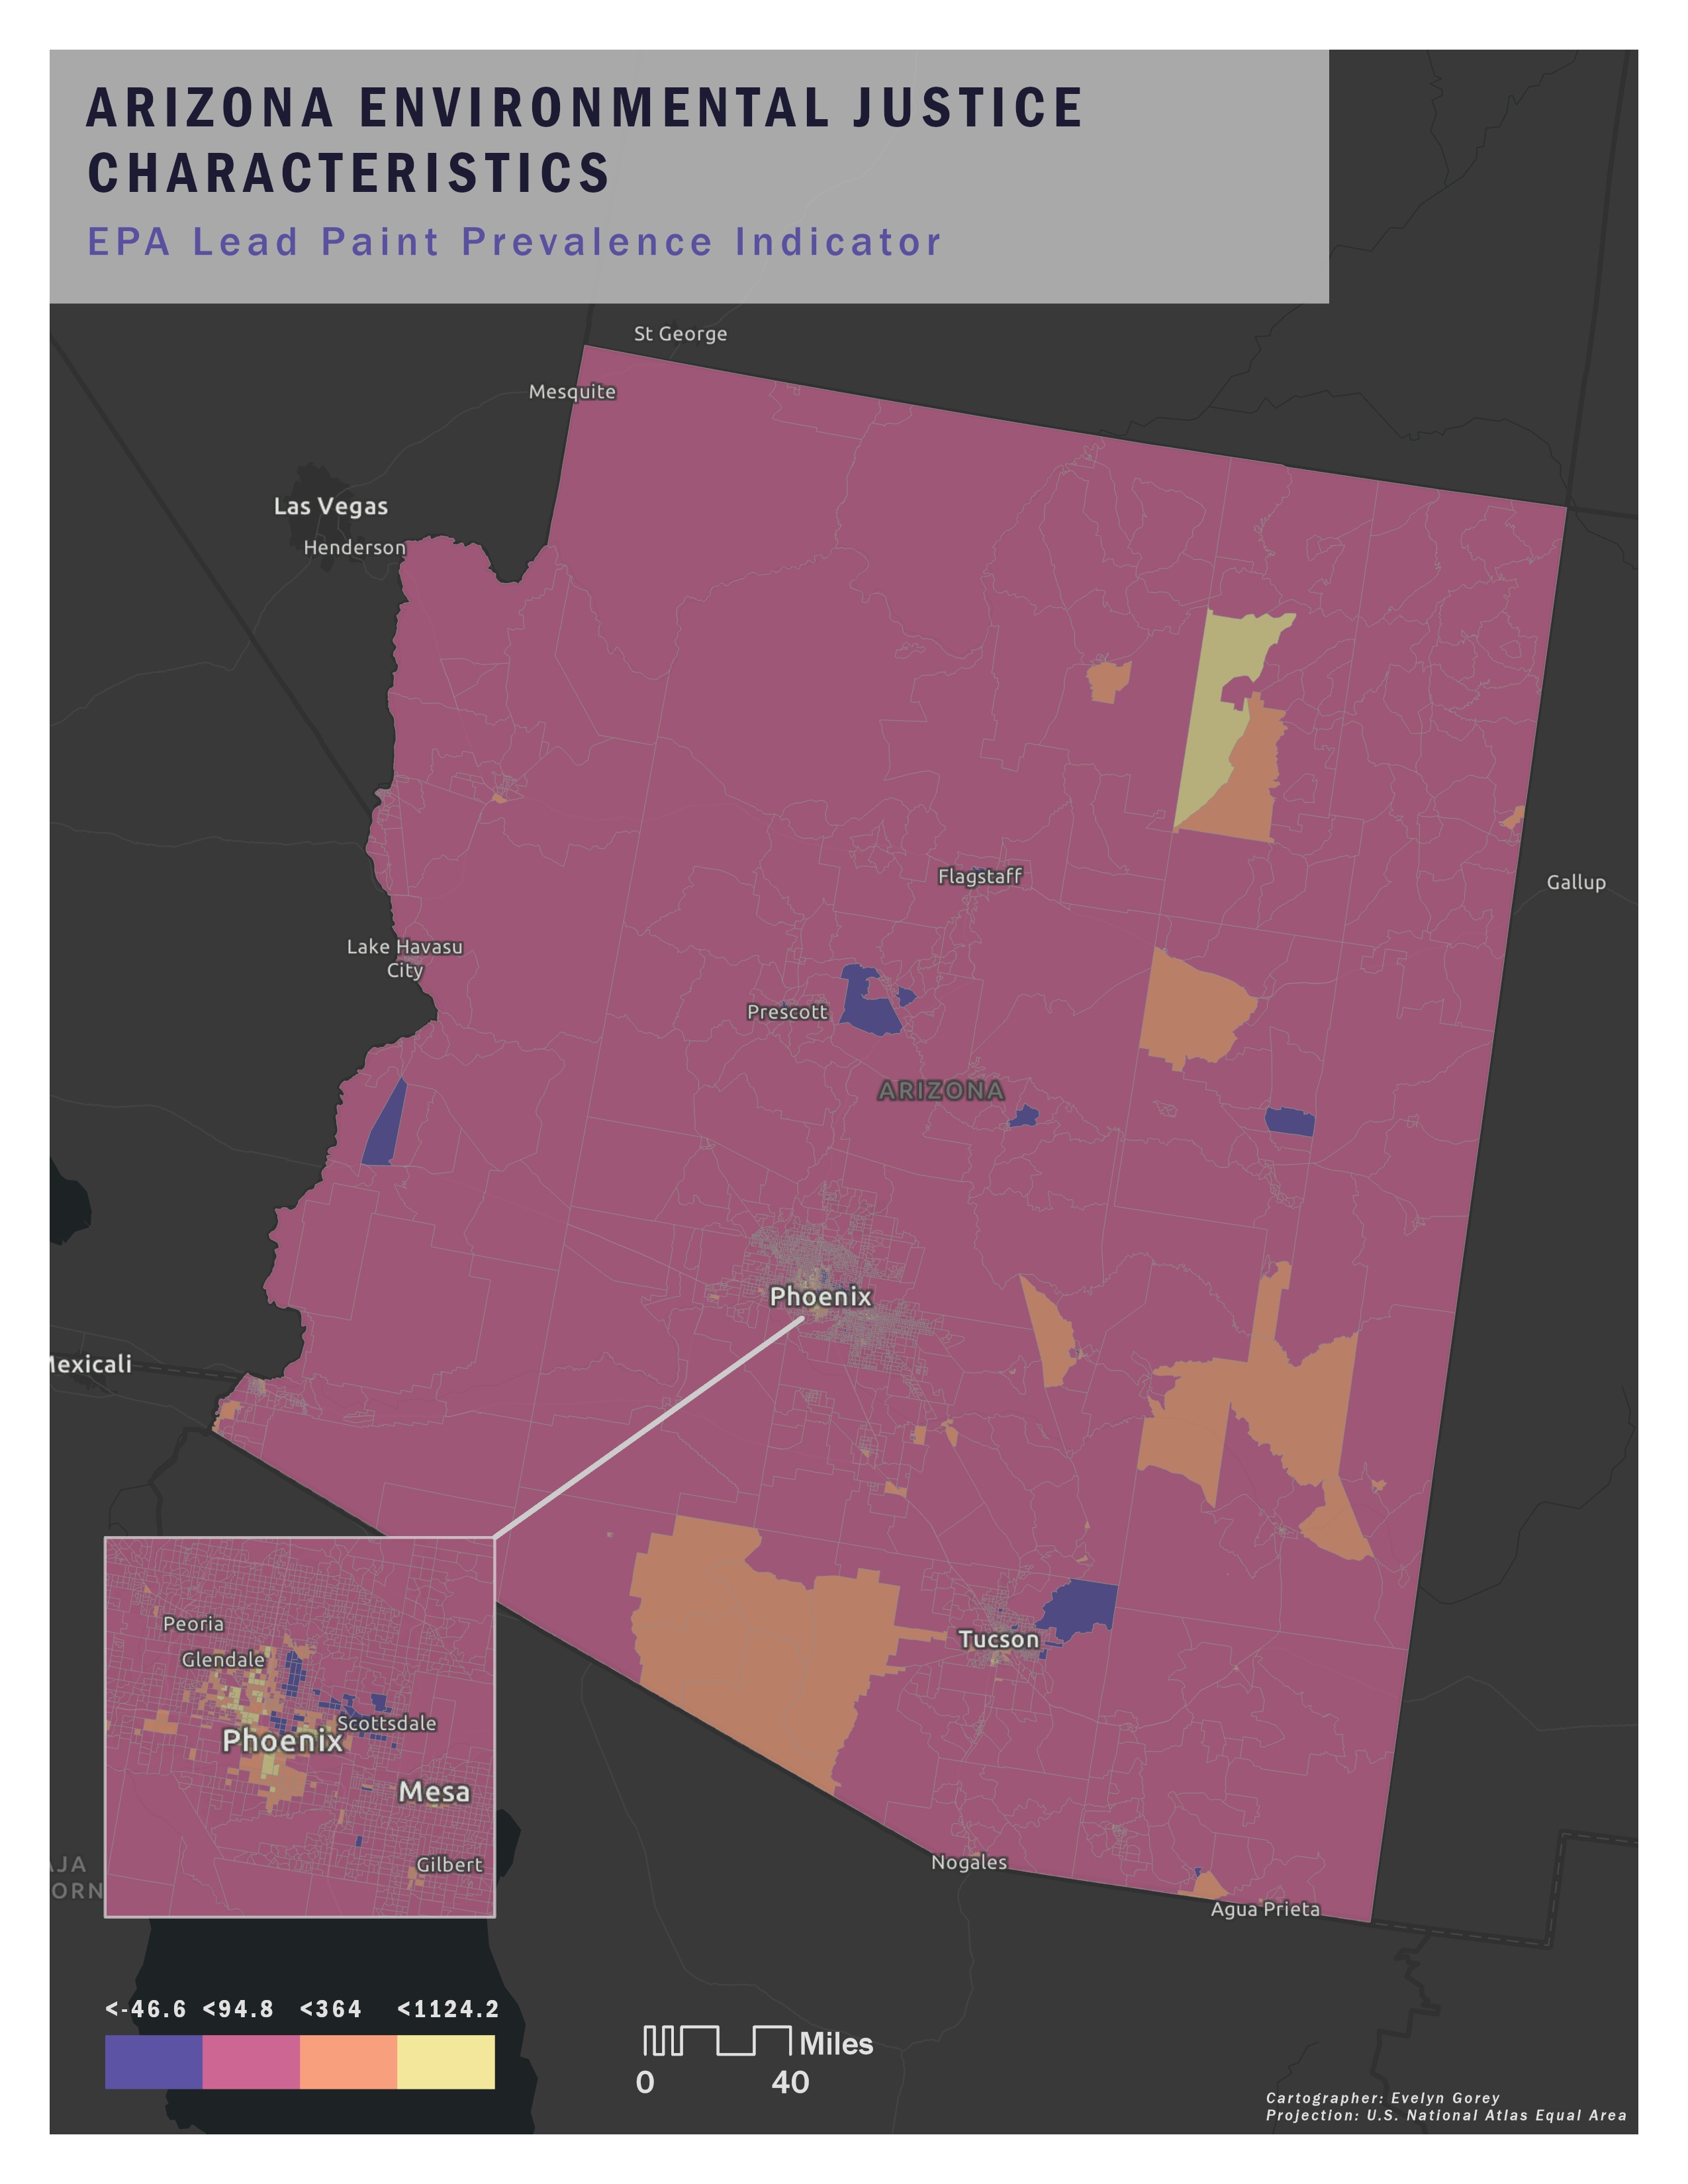
This analysis entails an exploratory analysis of the relationships between chosen variables (using the seaborn Python library and a Pearson correlation analysis) as well as the production of static maps to visualize these relationships. Correlation was tested to determine relationships between the percentage of minority (non-white) populations and five other variables: % low-income population, the air toxins cancer risk, the respiratory hazard index, the lead paint prevalence index, and proximity to National Priority List (NPL) sites (or extreme cases of Superfund sites).
The air toxins cancer risk and respiratory hazard index variables were found to have the two most significant correlation coefficients at .78 and .77, respectively. These relatively strong positive trends indicate that as the percentage of minority population rises in a census block group, cancer risk and respiratory hazard also both rise. The variable with no correlation is proximity to NPL sites, with a correlation coefficient of 0.07.
Below is the Jupyter Notebook presenting the results of the statistical analysis. Python packages seaborn, geopandas, and matplotlib were used in the analysis.
Below is a web map presenting each choropleth maps of a few of the tested variables for Arizona census block groups. The web map was made using MapBox and all static maps were made using ArcGIS Pro.
Results
Overall, the results of the exploratory analysis largely agreed with what I had already been expecting; for example, the somewhat high correlation between minority population and lead paint prevalence is already well-known nationally. One result that was surprising is that no NPL sites are located within the First Nation territories; given my research prior to the analysis, I was expecting at least a slightly higher correlation between minority population and the locations of NPL sites.
The results of this analysis indicate that the number of toxic sites such as the 500 located on Navajo lands is largely underrepresented by the EPA Environmental Justice dataset; this could influence decision-makers and researchers relying on this dataset to overlook the harm that sites of pollution not listed as NPL bring to communities. Because NPL sites are only a subset of national Superfund sites, additional analyses should be conducted with Superfund site locations to determine the relationship with the minority population percentage. However, the EPA should consider adding a Superfund site proximity variable (or other variables that can distinguish harmful sites such as the uranium mines) to its dataset for a more accurate representation of pollution.