Philadelphia Community Violence Intervention Ecosystem
Web Mapping
I developed the Philadelphia Community Violence Intervention Ecosystem tool (an
ArcGIS Experience Builder with custom widgets achieved with Developer Edition) for the
Philadelphia Department of Public Health (PDPH) injury prevention team. Its purpose is to help PDPH's
community firearm violence intervention partners (e.g., Hospital-Based Violence Intervention Programs (HVIPs), Cure Violence programs,
victim service agencies, etc.) locate and connect with one another, therefore increasing collaboration and client referrals.
PDPH collects information from partners on a yearly basis through an ArcGIS Survey123 form -- information collected includes program contact information,
geography/service area boundaries, services provided directly and by referral to clients, eligibility criteria, etc. Through this tool, programs can use the search,
filter, and "near me" mechanisms to identify and locate other programs working nearby. The data for each program collected with the Survey123 form are processed
with a Python script in ArcGIS Pro and uploaded to ArcGIS Online.
The tool will be public-facing since most of the partners are external to the City of Philadelphia, but the partners are the primary audience. ArcGIS Experience Builder
was chosen as the tool because it easily integrates with the Survey123 form, it requires little code but allows some customization through Experience Builder Developer Edition,
and it can be used as a website with many tabs -- we also have a resources page for our partners and a shared events calendar.
Because the app is not yet public, it could not be embedded, but the screenshots below provide insight into how the app looks and functions. User testing with partners and officially
launching the app, which will be hosted with AWS AppRunner, are the next steps.
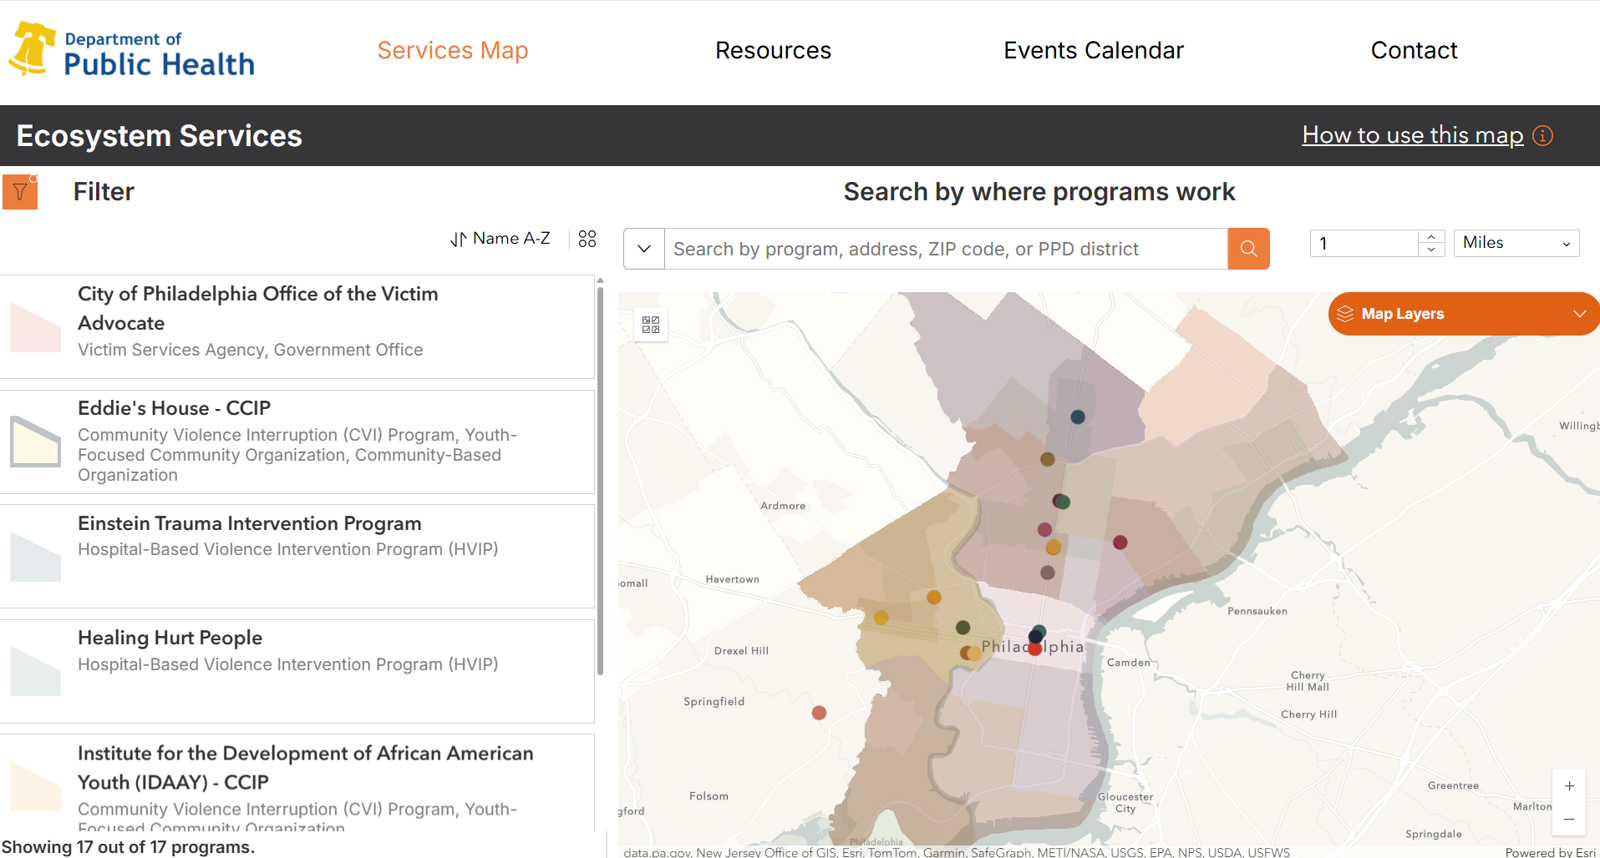
Programs layer
This is what the user sees when clicking the Services Map tab. The map displays multiple layers, including the program headquarters (points) and engagement/canvassing boundaries (polygon) of local community violence intervention service providers who are members of the injury team's Community Violence Interruption (CVI) and Hospital-Based Violence Intervention Program (HVIP) coalitions.
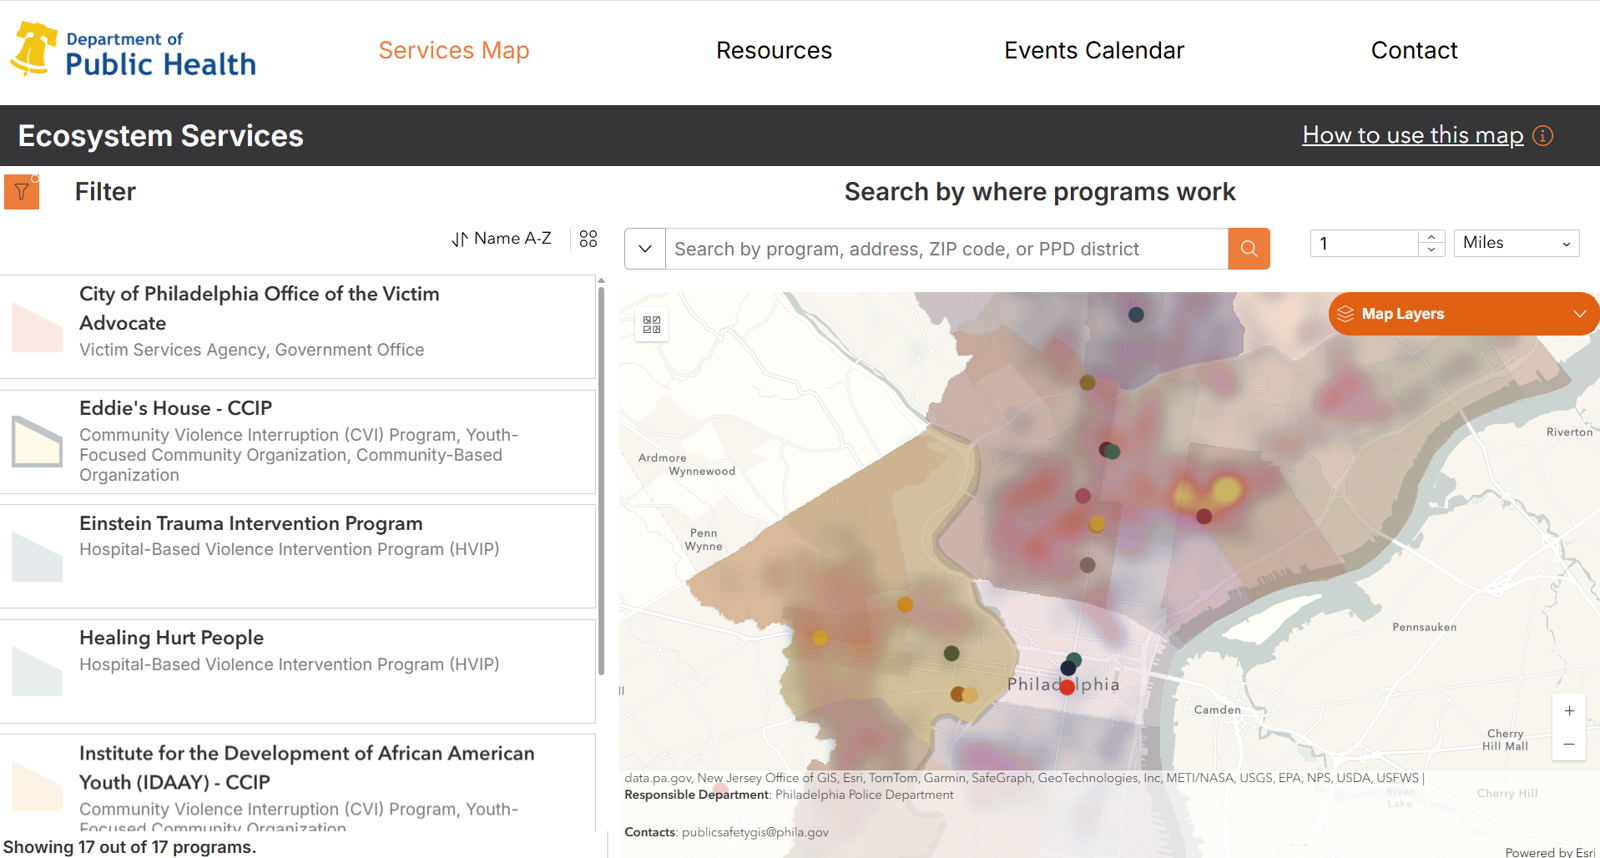
Firearm injuries layer
Firearm injuries, which are collected by the Philadelphia Police Department (PPD) and publicly assessible via ArcGIS Online (updated regularly), are also provided as a layer. A heat map of all firearm injuries is displayed when zoomed in at the city level, and points representing the injuries appear when zoomed in at the street level. Our coalition members expressed interest in having these firearm injury data overlaid on this map, and it helps orient the viewer to identify whether programs are located in areas with the most violence.
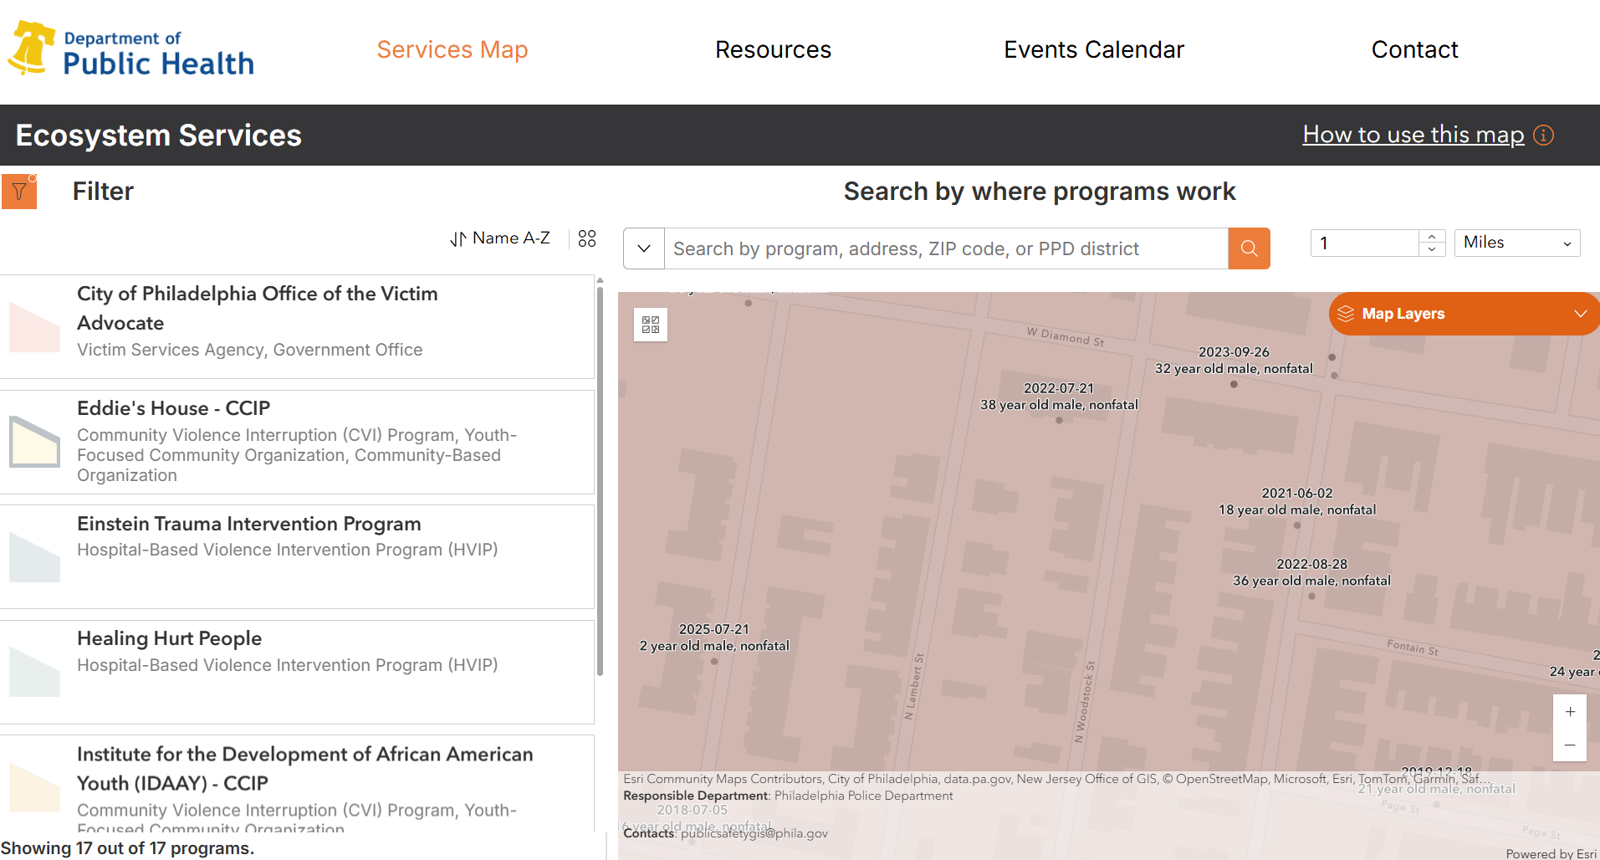
When zoomed in at the street level, the firearm injuries appear as points. Details about the injury are labelled above the point (instead of incorporated as a pop-up) to avoid clutter
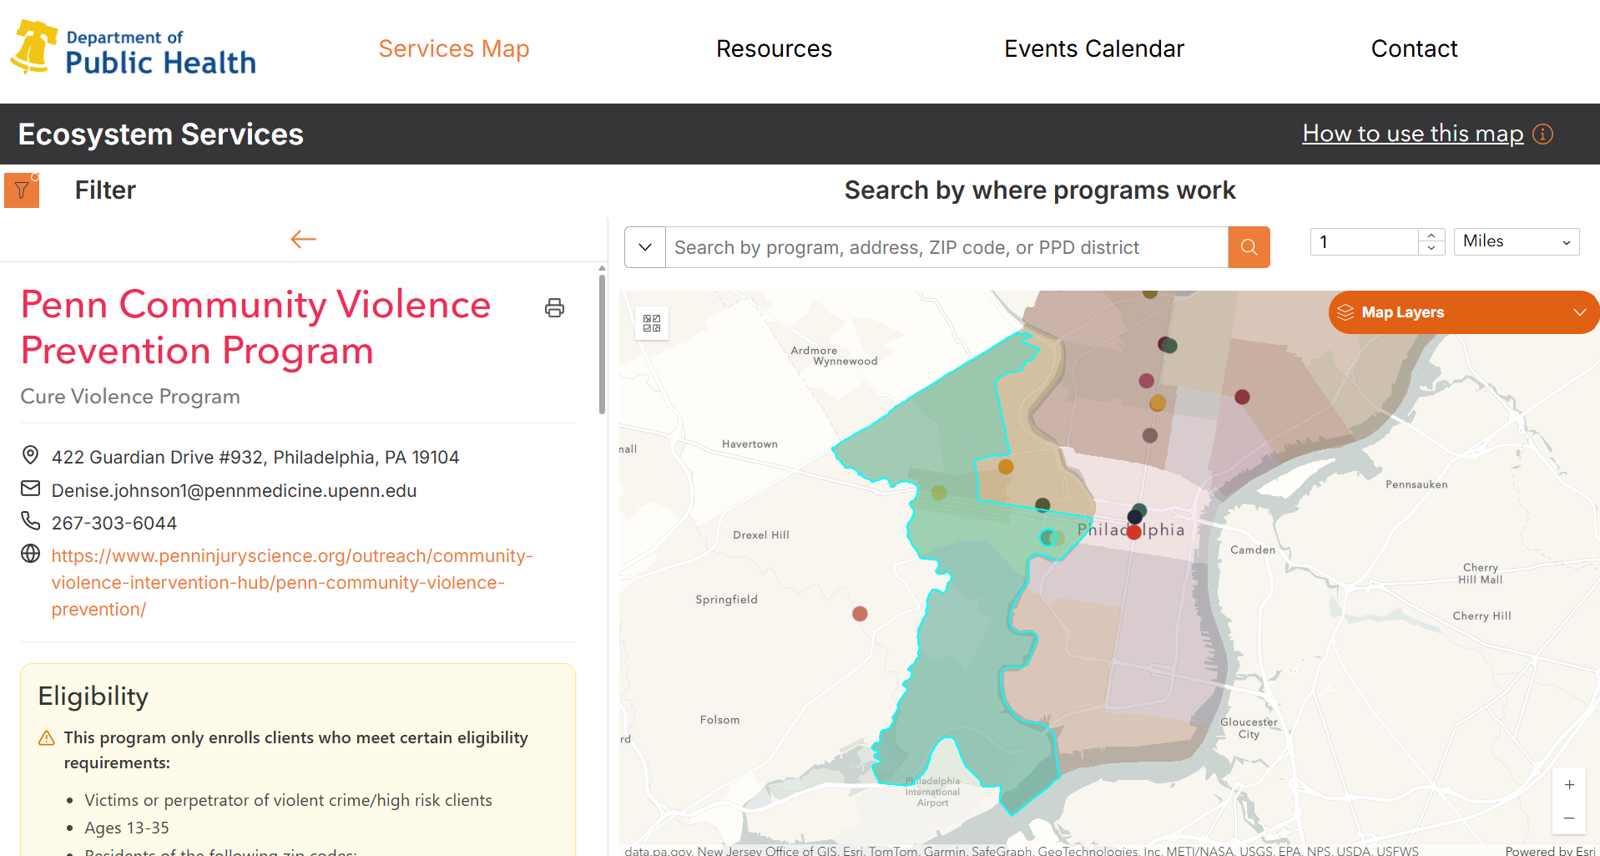
Program list
The user can click on the program list on the left side of the screen to view a program's details in an information card (note: this is a custom widget that I developed). Program addresses and contact information are displayed first. The program's headquarters (the point) is selected and highlighted in blue when a program is selected from the list, and if a program has an engagement boundary (i.e., the program canvassed and/or engaged with the community in this area within the past 6 months), the engagement boundary is selected on the map as well. Many of our HVIPs don't have engagement boundaries, as they operate within the hospitals and don't do street outreach.
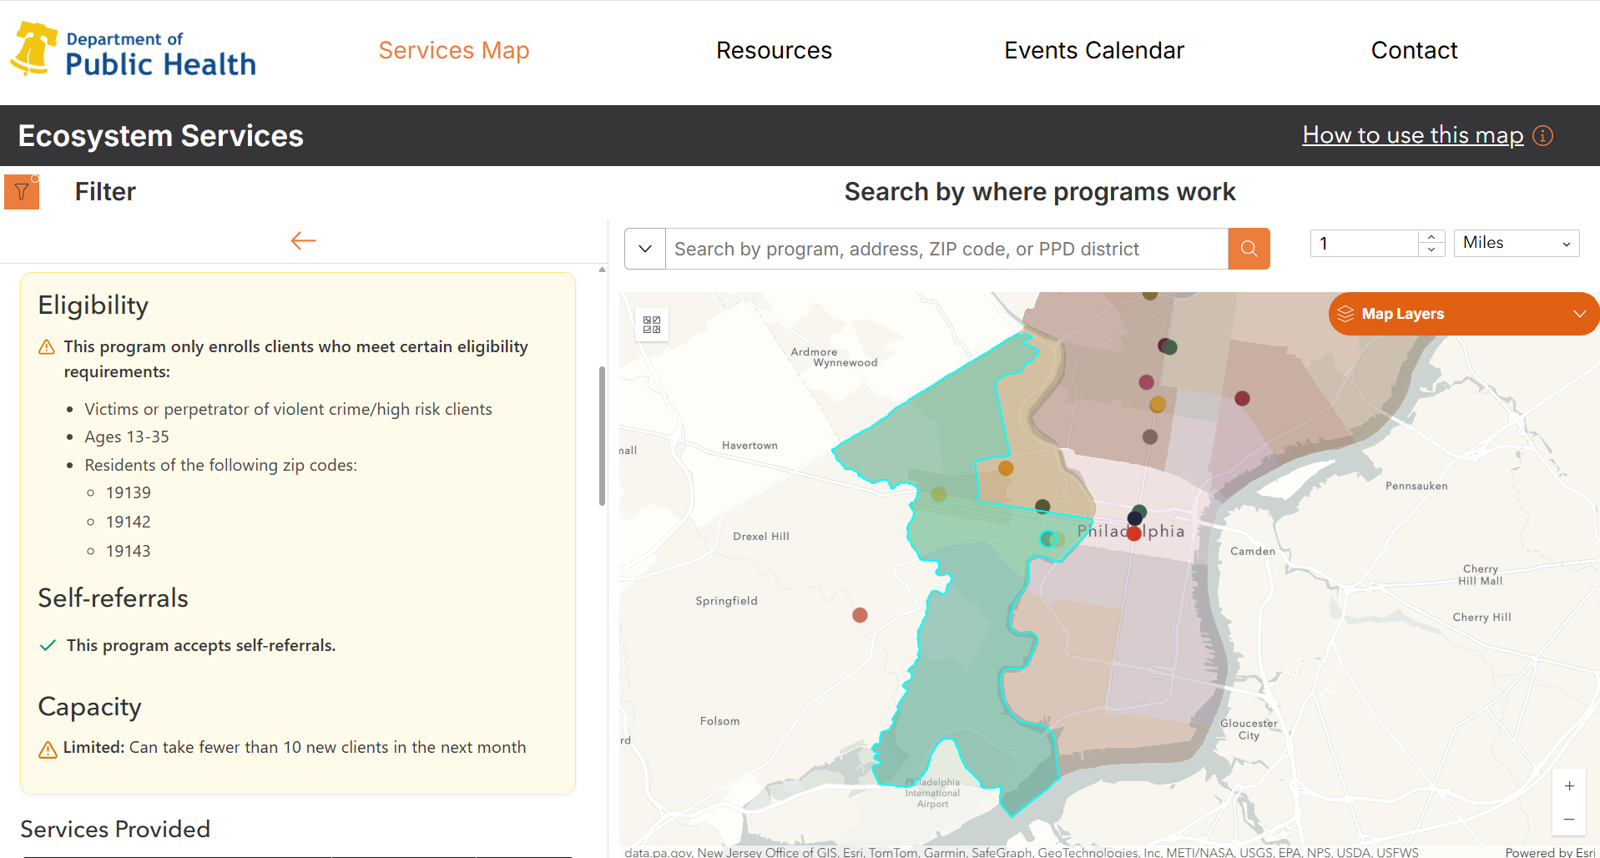
Program information card
Program eligibility criteria, referral details, and current capacity are provided.
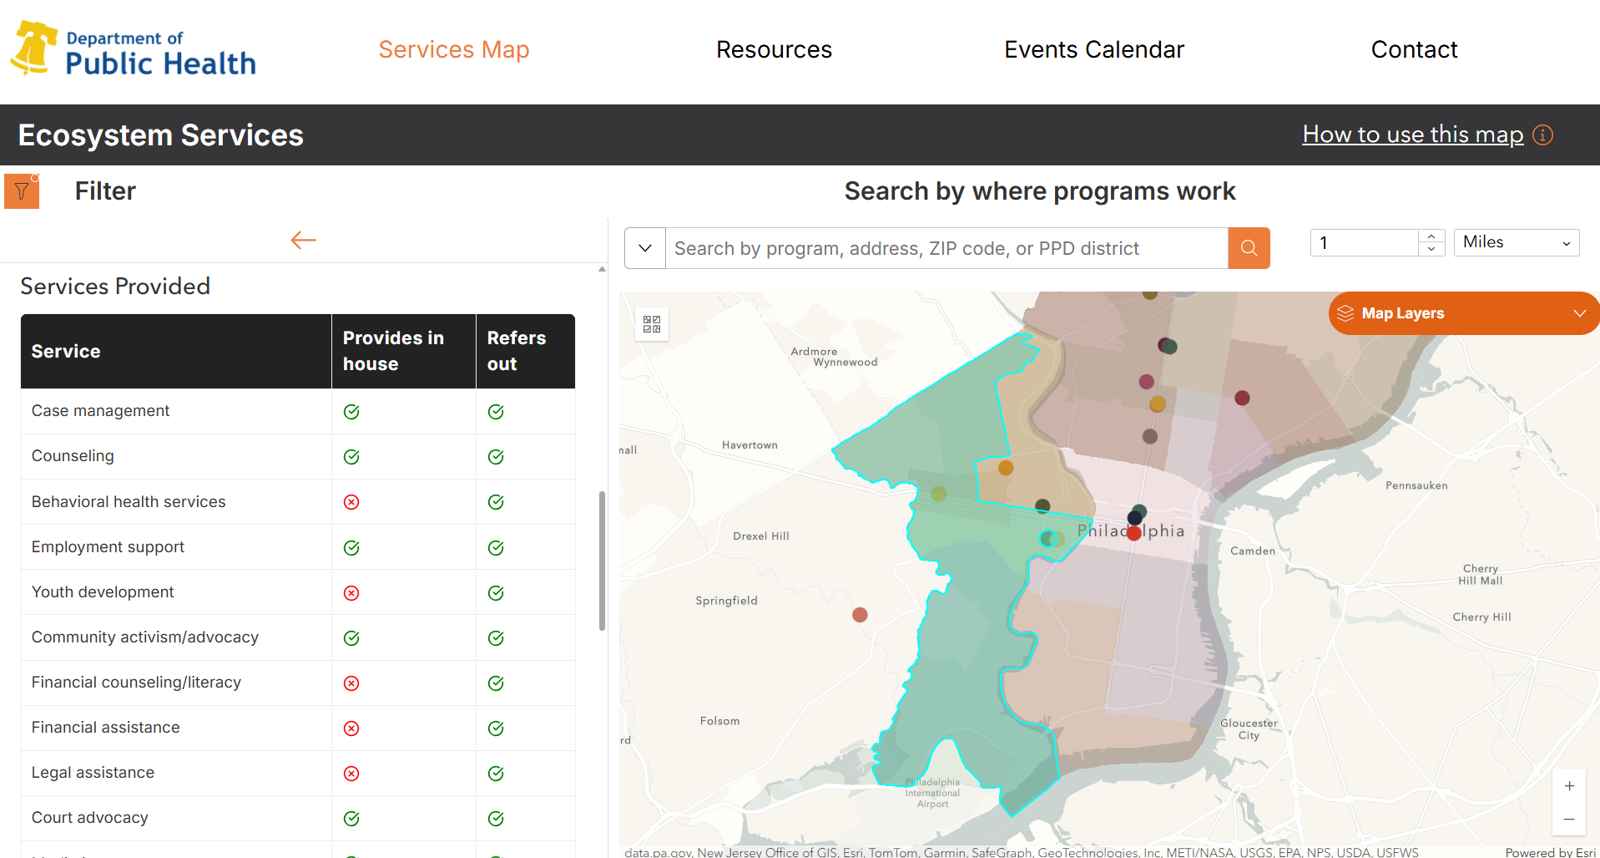
A table displaying the services that programs provide directly/in house versus the services they can refer patients out to is provided.
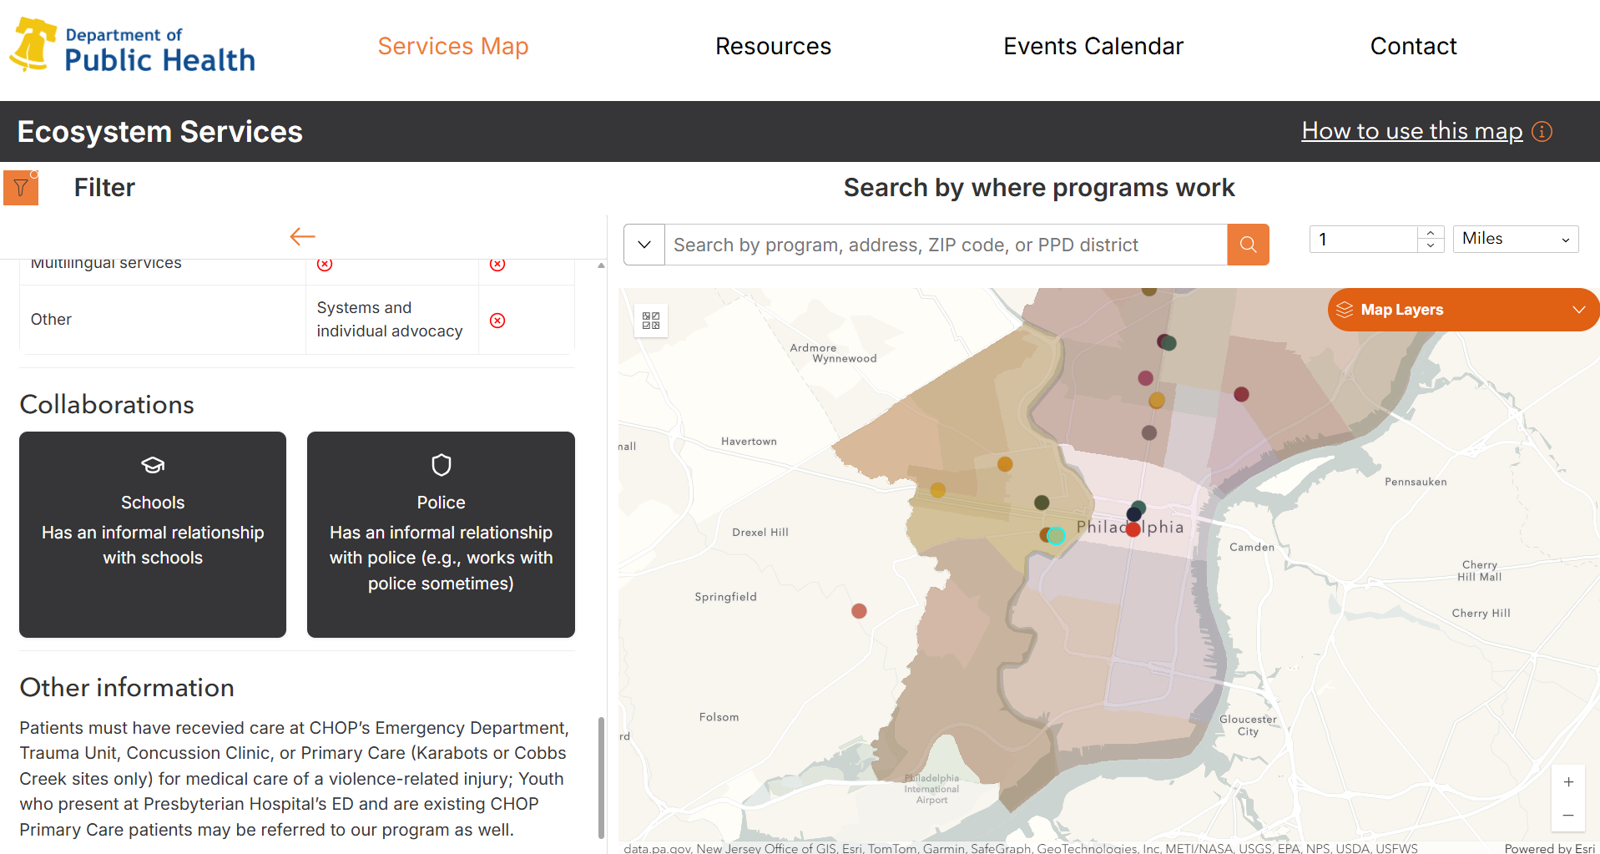
If a program provided multilingual services or services not included in our servey form, these services are specified within the "Multilingual services" and "Other" boxes in the services table. Programs' relationships with schools and the police are also displayed under the "Collaborations" section. If a program provided additional information about their program, this information is displayed at the bottom of the card. The card is also printable.
Filter
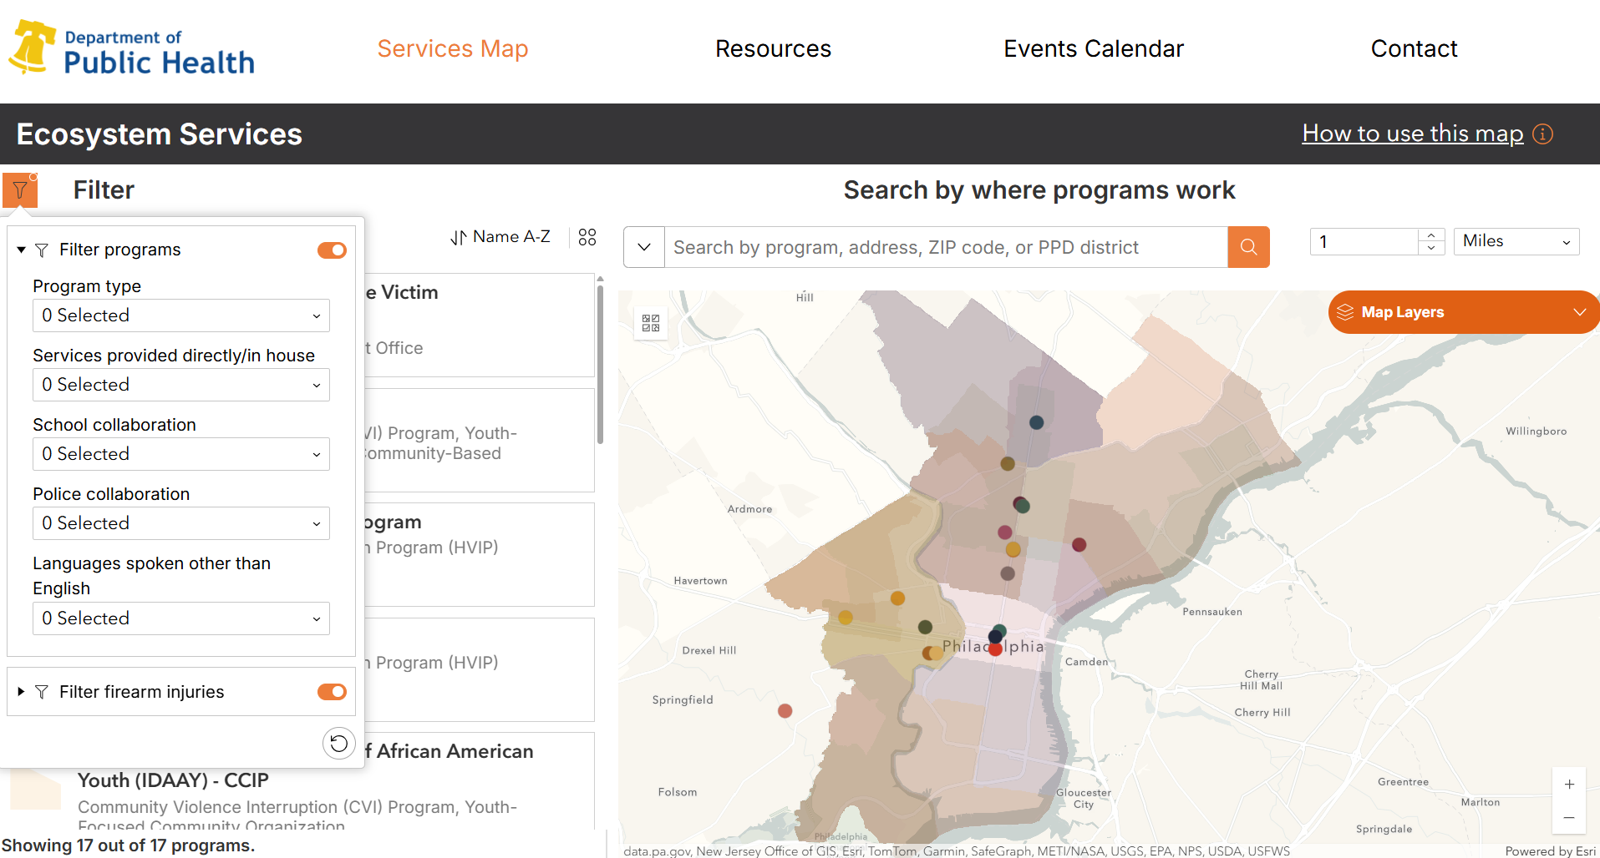
Users can filter the program list by program type, services, relationships with schools and police (i.e., some program staff have school clearances, or some programs don't work with the police at all -- these may be helpful to know when a service provider is referring a client to a program), and multilingual support (i.e., which languages other than English are spoken).
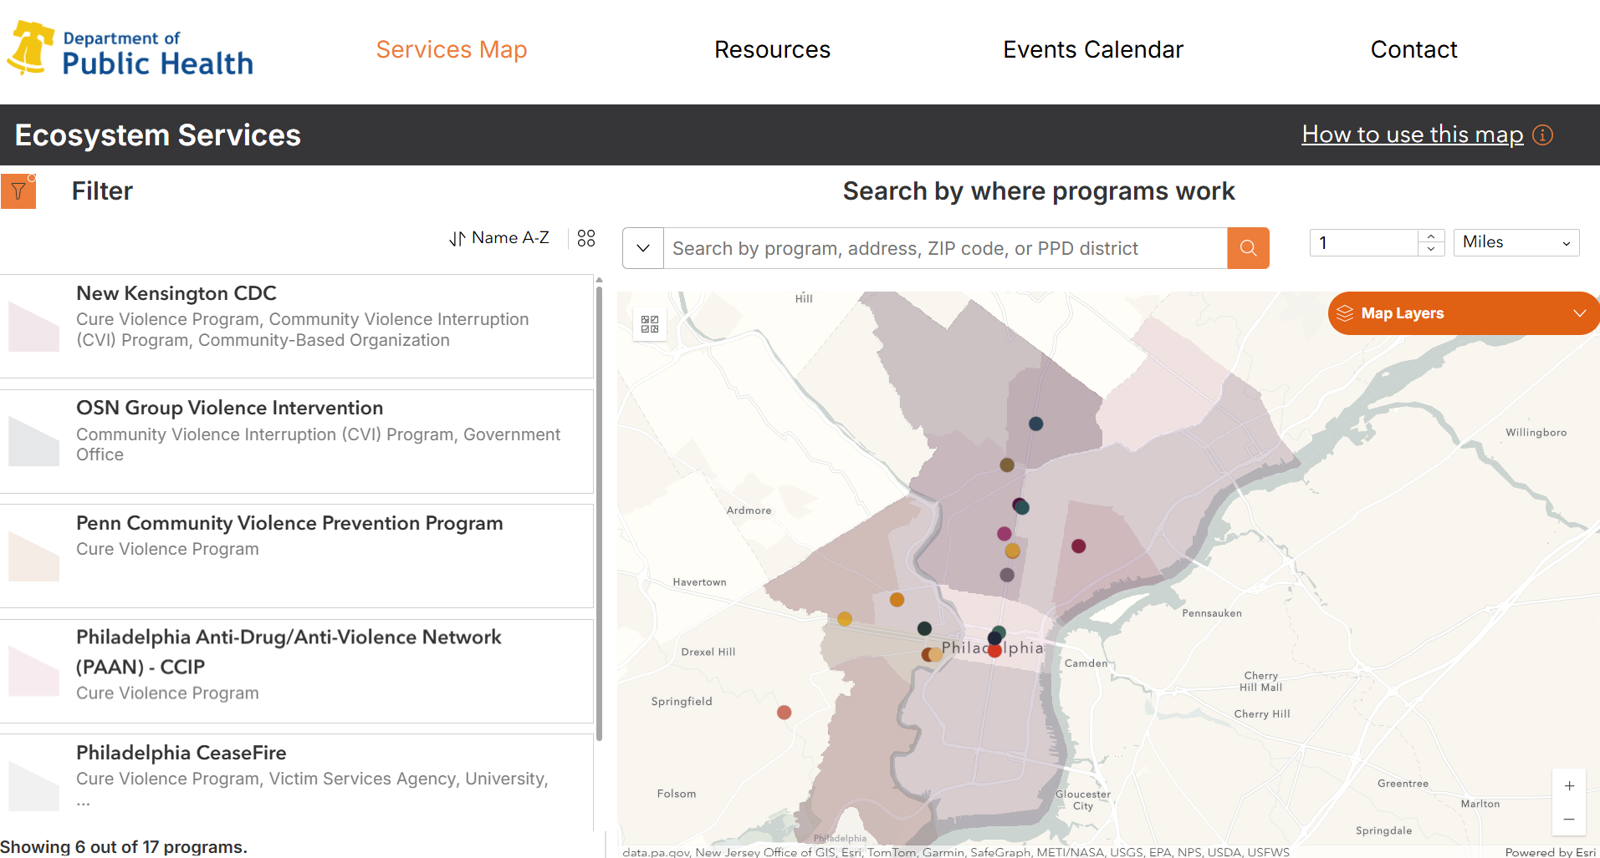
This shows the filter in action -- only 6 programs now appear in the list (and their engagement boundaries are filtered on the map) according to the program type and services filters set by the user.
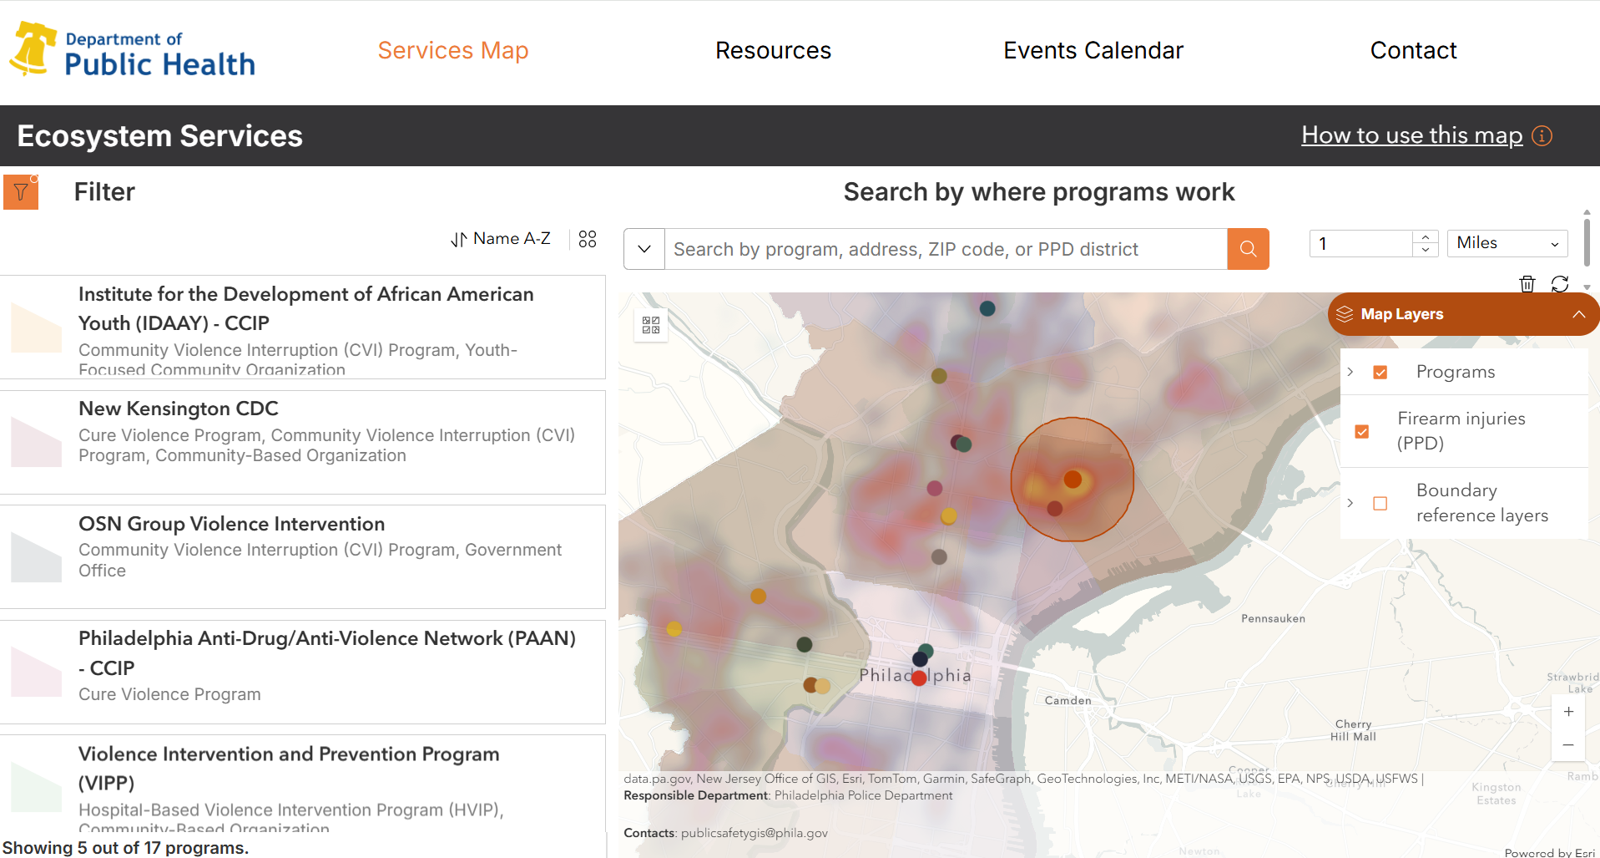
Search and Near Me
Using the Search widget, which sets the location of the Near Me widget, users can click anywhere on the map (e.g., the city's biggest hotspot of firearm violence) to find the programs that have canvassed/engaged with the communities surrounding that location (in this case, it's within 1 mile, but the user can specify the distance) within the past 6 months. The program list now displays the 5 programs that have engaged within 1 mile of that location.
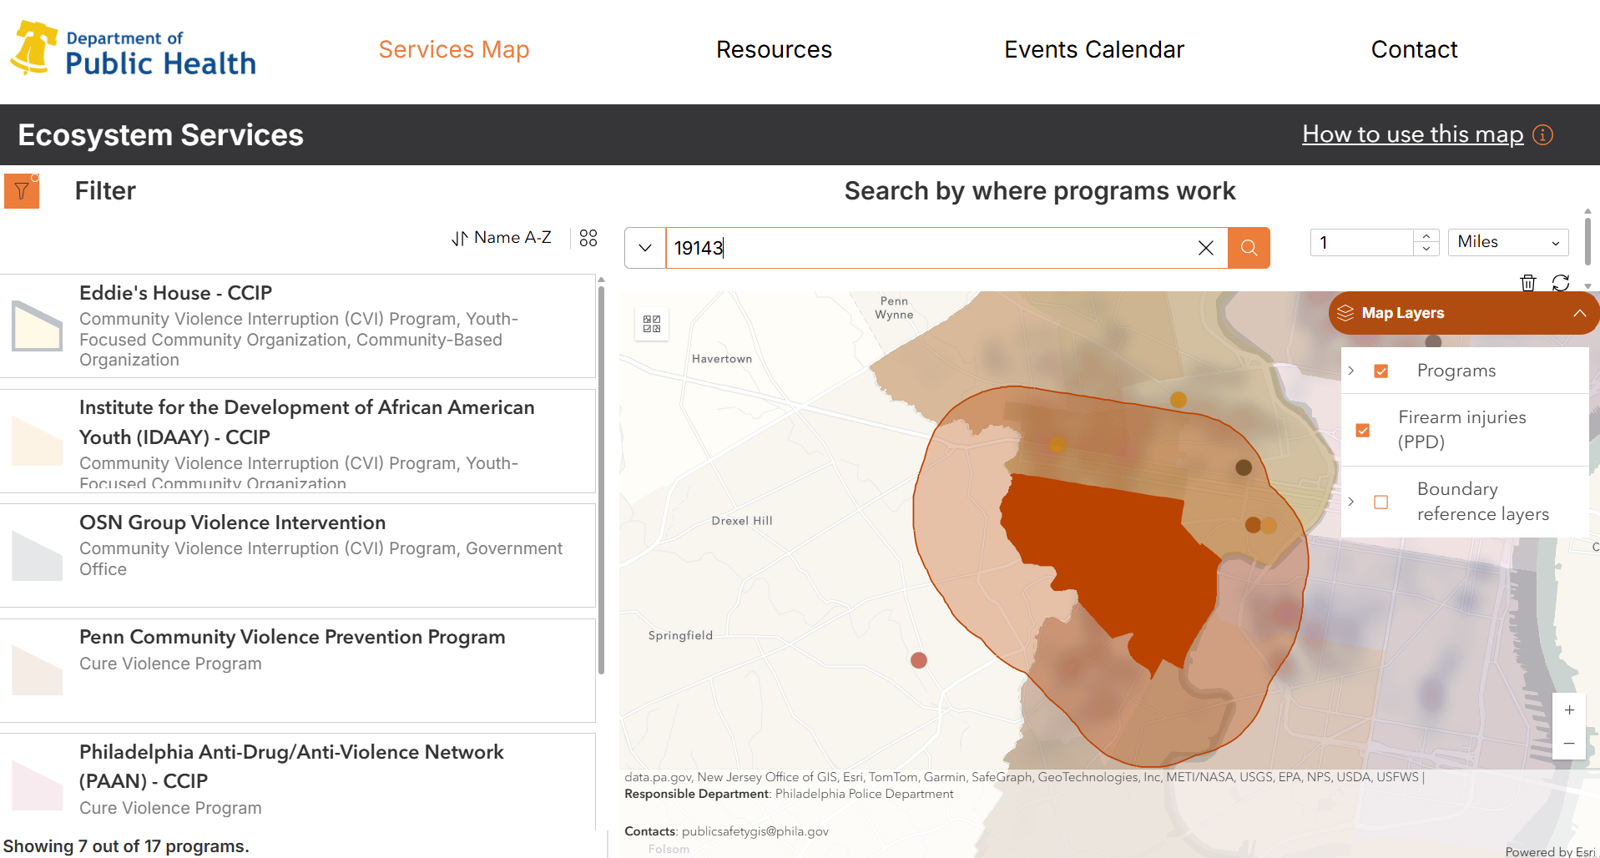
The same can be done using ZIP codes or police districts (many of the programs use police districts to communicate where they work).
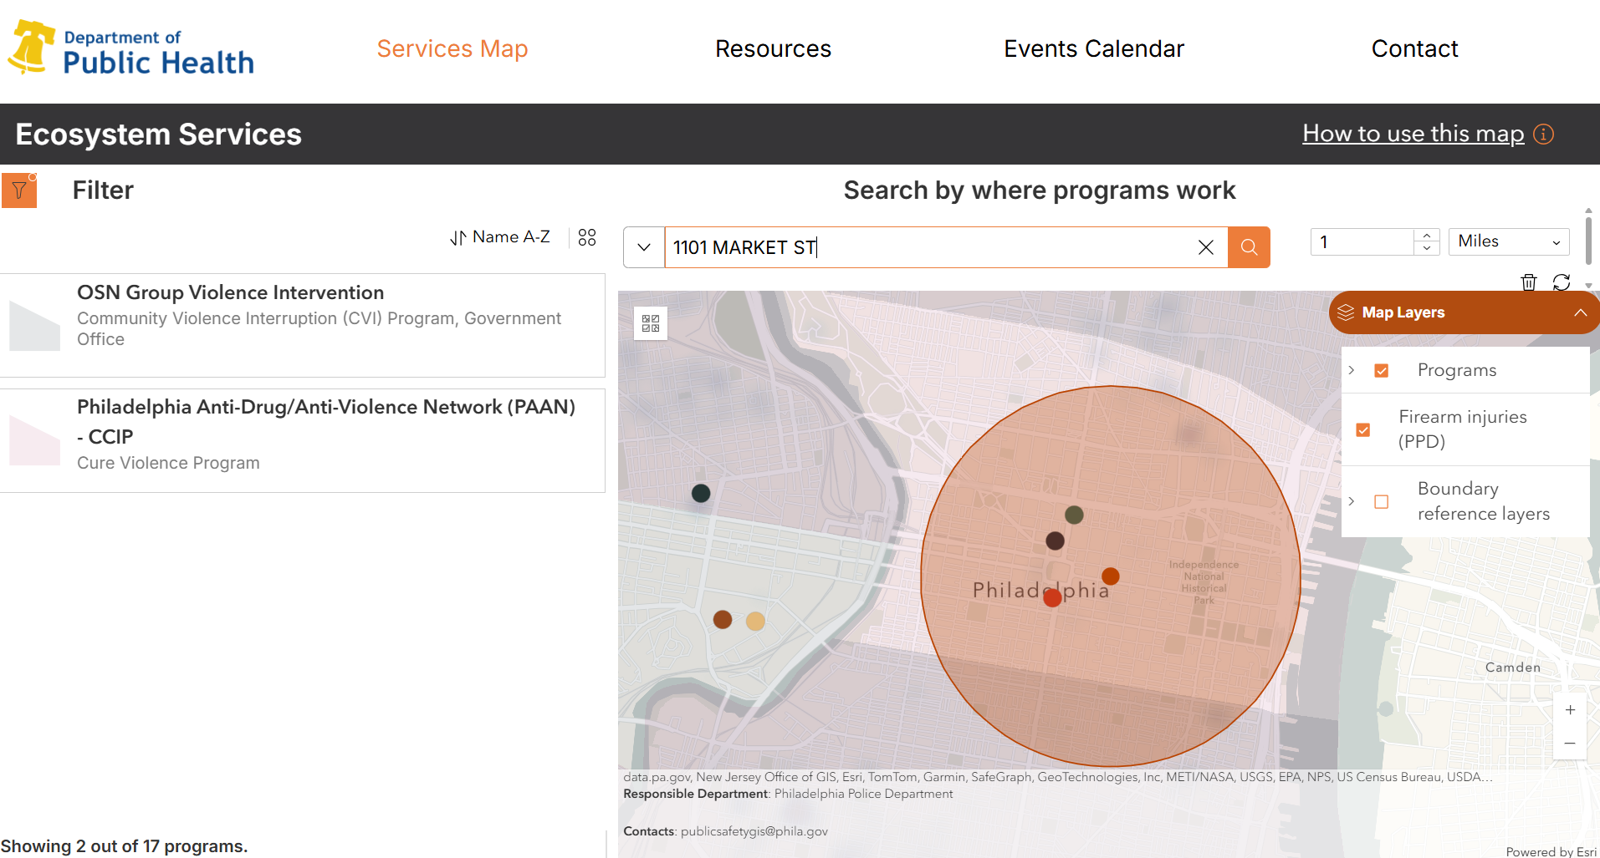
The same can also be done using addresses. Zoomed-in point locations of firearm injuries (which can be filtered) can also be used to find programs nearby.