Coloring USGS point cloud data
Cartography
To build off of my Relief Maps & LiDAR Visualization of Sequoia National Park project, in which I was visualizing point cloud data to incorporate in a larger music project, I wanted to 1) download point cloud data for multiple locations in the U.S., 2) colorize the data using natural color aerial imagery, 3) visualize the scenes in 3D, and 4) embed in a larger video alongisde corresponding drone footage.
To accomplish this, I defined multiple areas of interest in California, Oregon, and South Dakota that corresponded to the locations where the drone footage was filmed. After manually defining these areas' coordinates, I downloaded LiDAR/point cloud data for these areas from the United States Geological Survey (USGS) through the USGS Data Download Application and corresponding NAIP imagery from similar time ranges through USGS EarthExplorer.
I closely followed this tutorial by William Pearce to set up my Python environment and run this Jupyter Notebook to 1) merge the LiDAR sources, 2) crop the merged data to defined bounding boxes, and 3) colorize the LiDAR data using the NAIP imagery using a combination of packages, including rasterio, lastools, and PDAL.
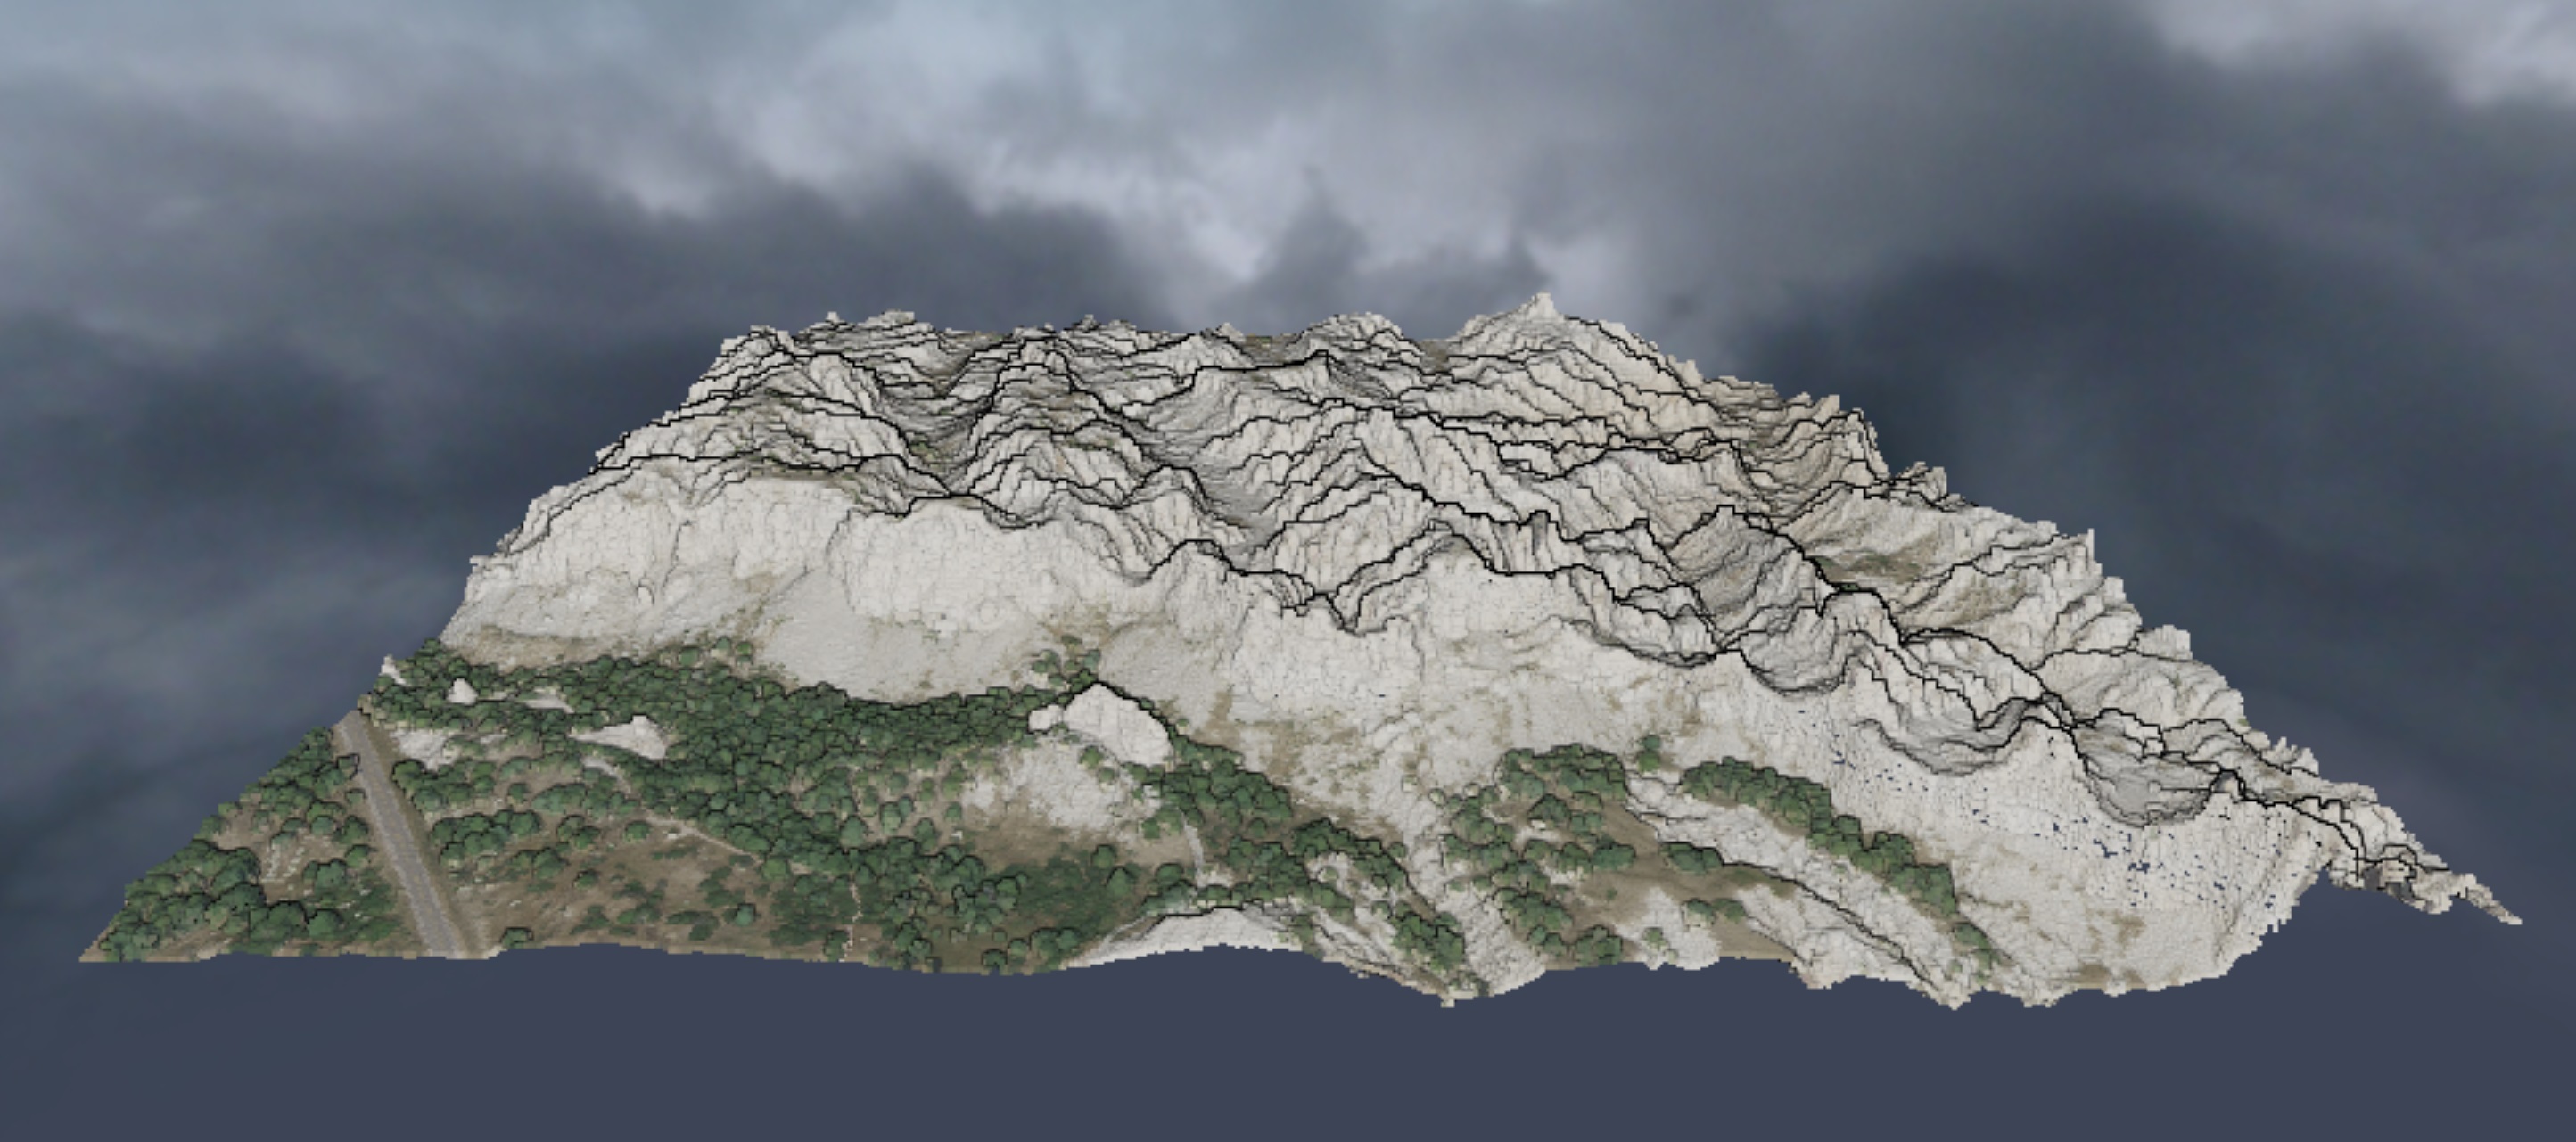
I then used Potree Viewer to render my colorized LiDAR data locally; from these renderings, I was able to screen record to capture videos that mirrored the corresponding drone footage and embed them in a larger video. Below are screenshots of these renderings.
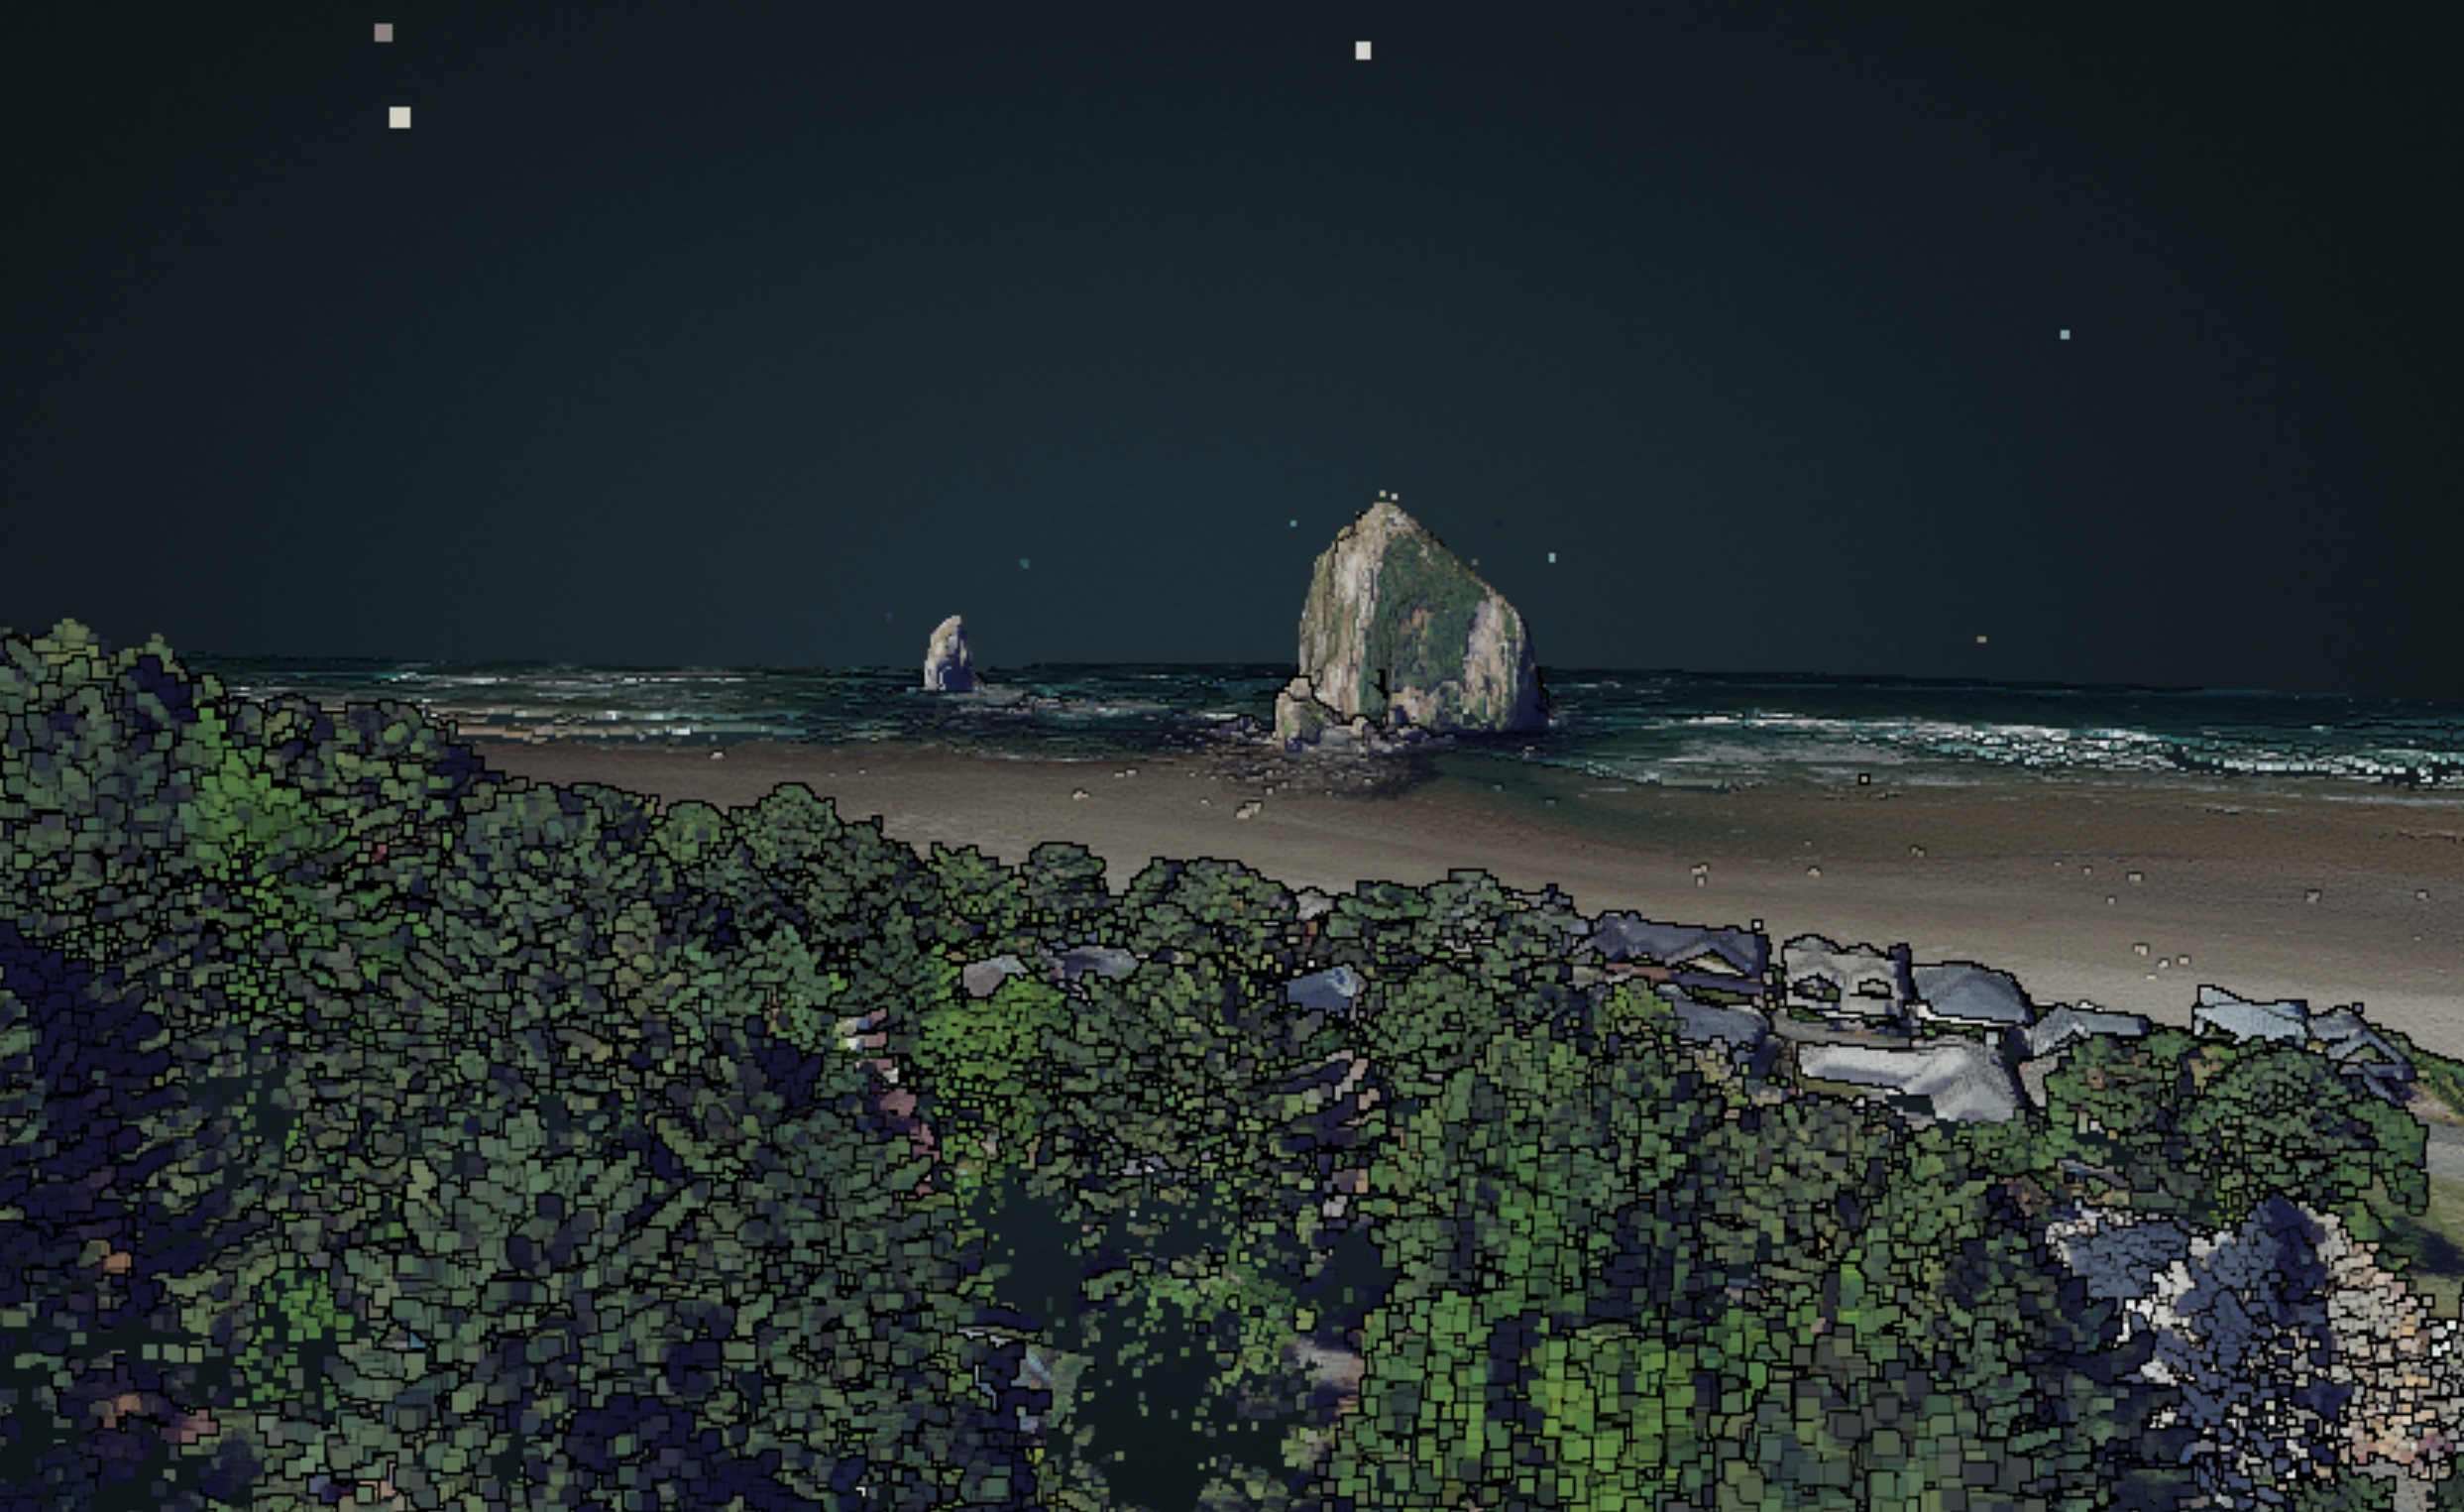
Haystack Rock, Oregon
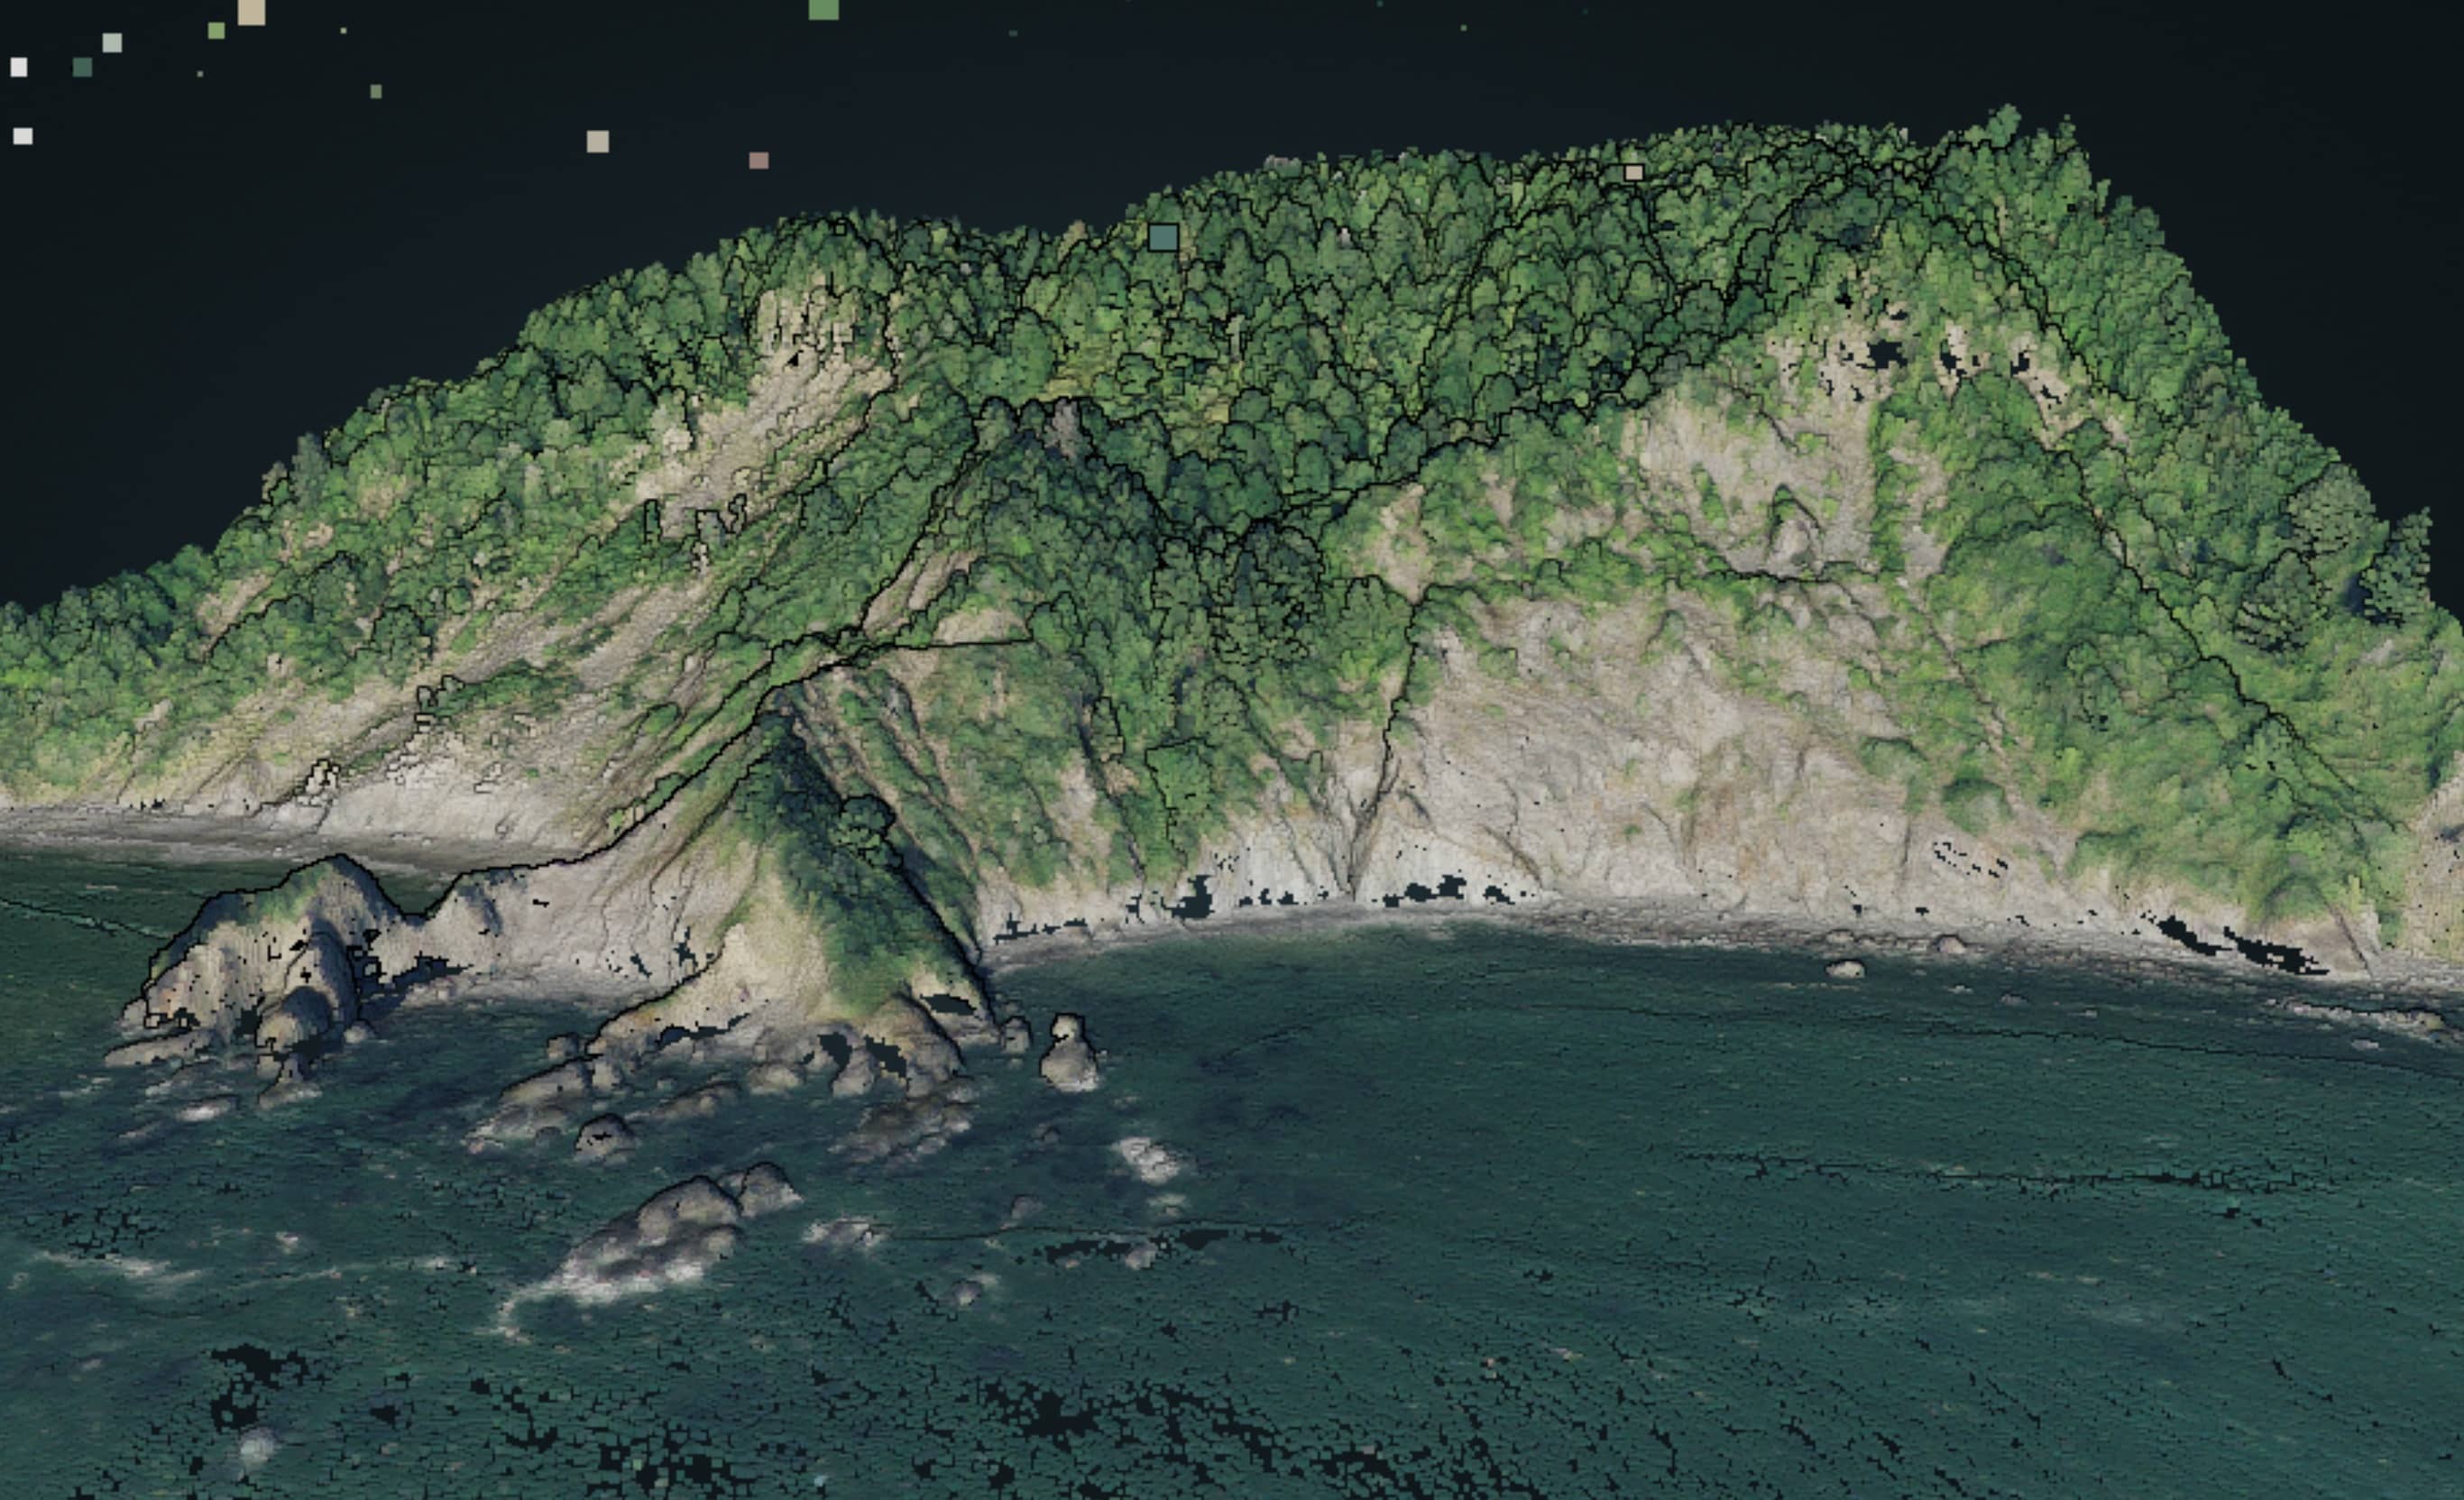
Endert Beach, California